Why you should use Log Scale Charting

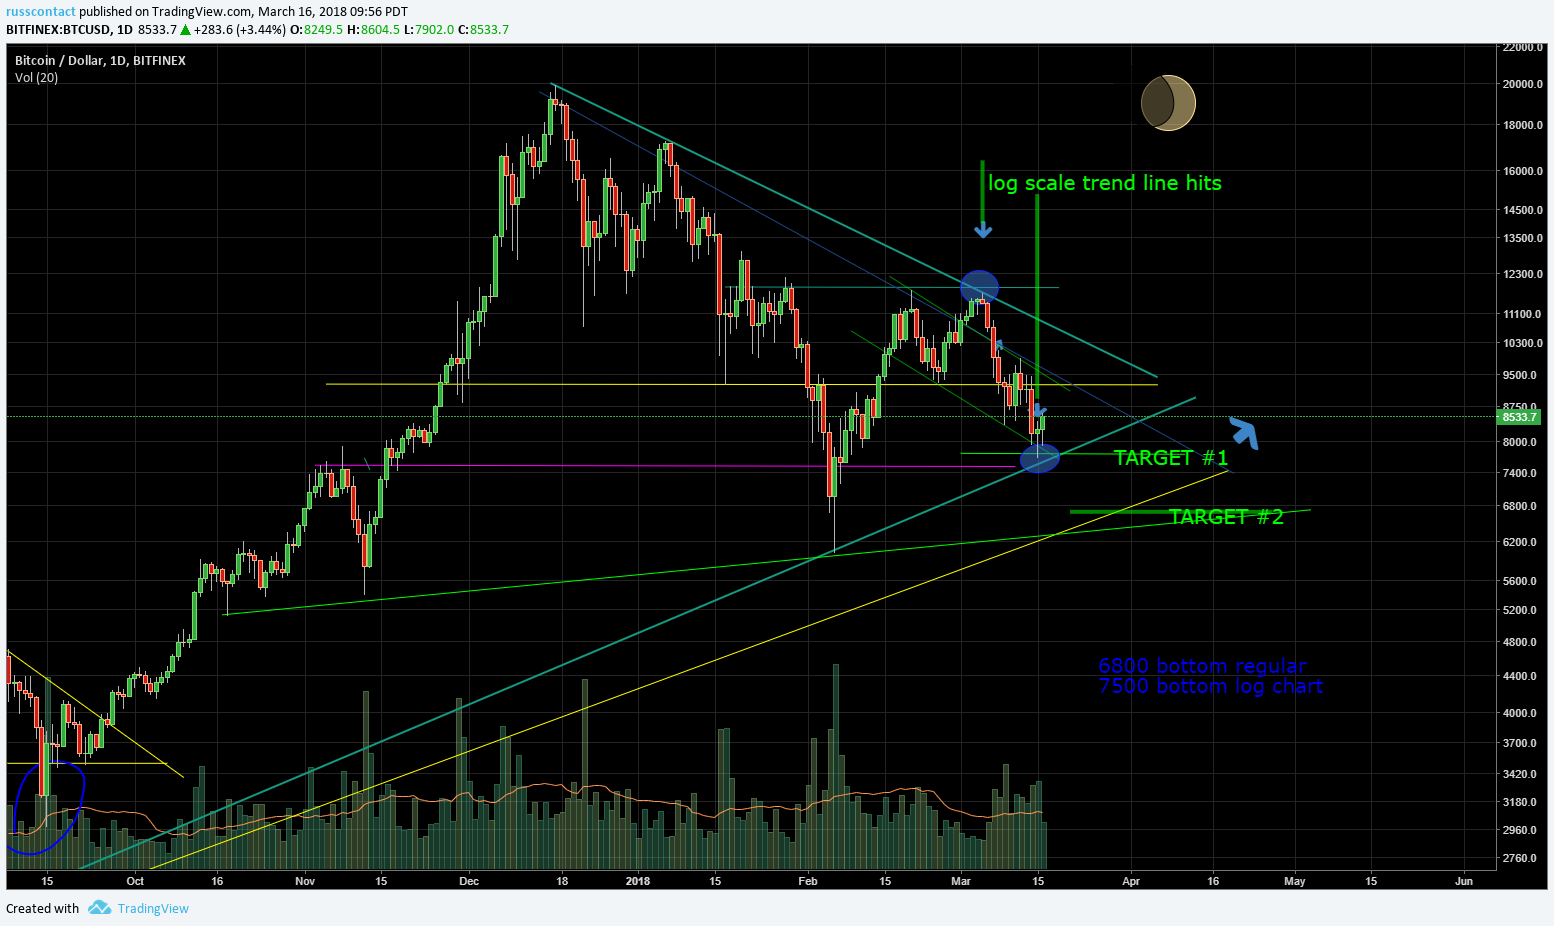
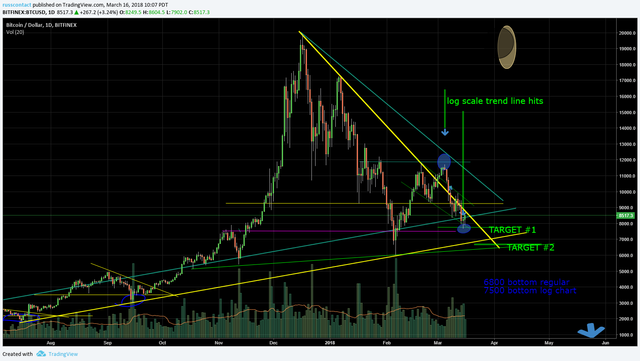
In this post I want to show you why you should also use log scale charts in your technical analysis. As you can see in the first chart which is set to log scale Bitcoin price bounced off the major down trend line and the major up trend line. (blue green lines) In the second chart which is not set to log scale you can see that the bounces missed the major trend lines. (yellow)
This is not always the case, but log scale bounces and non log scale misses occurs often enough you should be aware of this price action possibility. I have been told that professional traders use the log scale, so us amateurs should consider it as well.

Sometimes you have to search for the log option in your charts. The bitcoin charts that I use are on tradingview.com In the second photo the large arrow in the lower right of the chart points to the logarithmic option.
Please recall, that I am not a professional financial advisor and this is not professional advice. Do your own research. There is always something new for us to learn and the log charts are very important.
If you like this post, feel free to "Resteem" this post and follow me by clicking on my title "Blogg" above. good day.