Steemit Crypto Academy Season 3-Week 7 | Trading Crypto With Average Directional Index (ADX) Indicator
INTRODUCTION
Hello guys it's the 7th week of the steemit crypto academy season 3 the courses taught have be great topics and I really enjoyed them. This week assignment by @kouba01 is on trading crypto with average dimensional index indicator(ADX indicator). And the lecture covers everything we need to know about the topic. Here is the part I show my understanding on the topic.
Let's get started

1. Discuss your understanding of the ADX indicator and how it is calculated? Give an example of a calculation.
ADX indicator
The ADX indicator is an acronym from the main word Average Directional Movement Index. This indicator is a special one because it doesn't tell the trend of the market whereas it only determine the strength of the trend. You can see it a special one. ADX line indicates the strength of the trend. It doesn't matter if the trend is bullish or bearish. It determine the strength of both trend. Even when there is no trend in the market this line still shows us that there is no trend or the trend is a weak one.
The ADX line ranges from 0-100. With this range we know how strong the trend is or if there is no trend in the market chart.
- 0-25 when the Line is in this range it shows that there is no trend or the trend is very weak.
- 25-50 the line in this range shows that there is a trend in the market
- 50-75 the line in this range show us that the trend is strong
- 75-100 when the line is this high the ADX line is showing us that the trend is extremely strong.
This range is for both the bullish trend and the bearish trend. We have to know that the most important range is when the line is on the 25 scale. This is telling us two things first will the price rise above this level or it will still go below the 25 meaning the trend is till weak. The 25 scale is the boundary between trend and no trend.
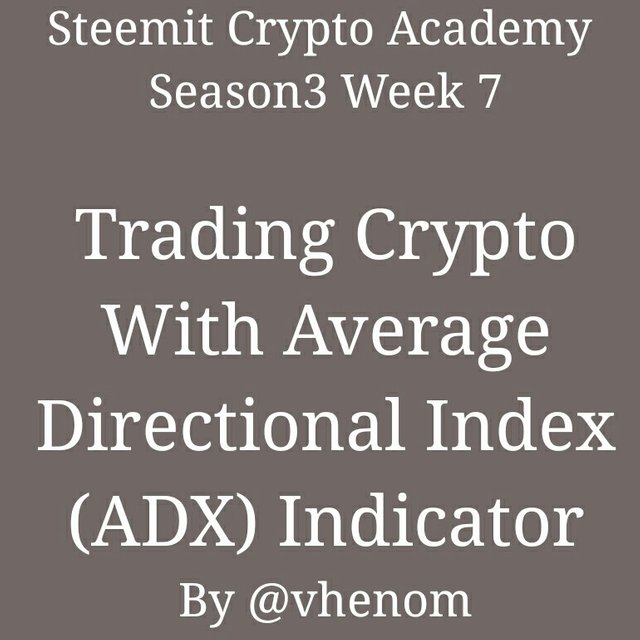
Bellow is the ADX line on the BTCUSDT chart
Now that we have known that the ADX doesn't read trend what do we do we need indicators that read trends to pick signals. But the ADX indicator got us covered by providing two other lines alongside with the ADX line to determine the trend of the market. This lines is the Dimensional Movement Indicator (DMI) the DMI consist of both positive and negative line +DI and -DI this lines are use with the ADX line so it will be easy to use.
With this lines it makes the indicator easier to use. Because the DMI reads the direction/trend of the market while the ADX will tell us the depth of the trend. Isn't this funny. The ADX line is giving us that confidence that the trend is strong and if not we will also know.
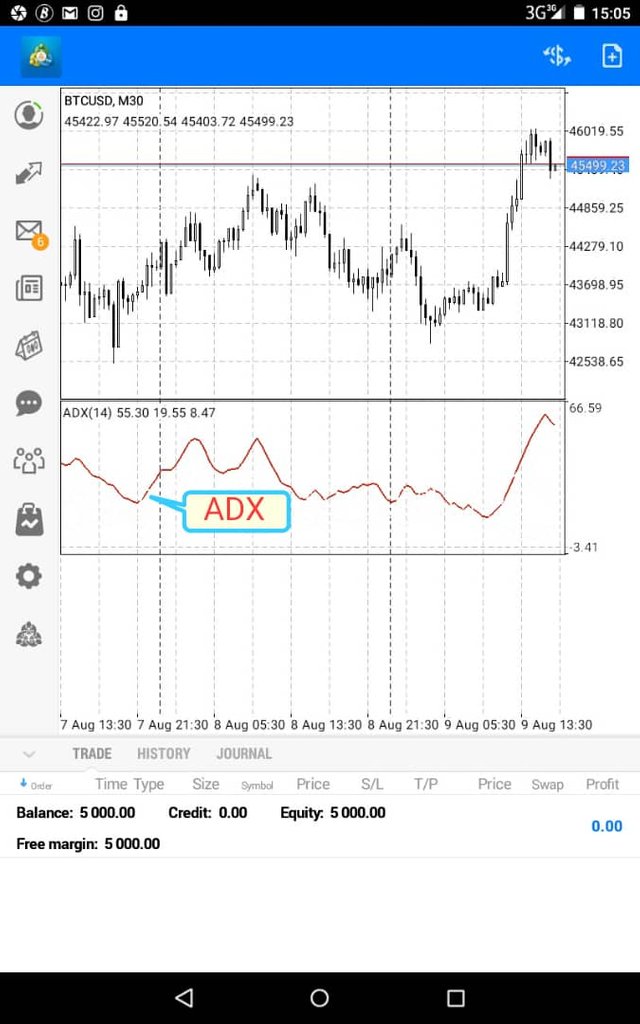
Above is the screenshot showing all the line that makes up the ADX indicator. The lines measures the high and low over a 14 period.
Moving on, the +DI curve indicates a bullish trend while the -DI curve indicates bearish trend. So when the +DI curve is above the -DI curve then we know that the trend is bullish likewise if the -DI curve is above the +DI curve then the trend is bearish. As this line are detecting either bearish or bullish, the ADX curve is showing us the strength/depth of the trend.
How to calculate the ADX indicator
I will show how to calculate the ADX indicator lines. I will start with how to calculate the DMI lines. For this you know there are two lines so we calculate for +DMI when the trend is bullish and -DMI when the trend is bearish.
Positive Dimensional Movement Indicator (+DI)
To calculate this line of the +DI we will subtract the price of the current high from the previous high.
+DI = current high- previous high
DI+= DMI+ /TR
Negative Dimensional Movement Indicator (-DI)
To calculate the lines of the -DI we will subtract the price of the current low from the previous low.
-DI= current low- previous low.
DI- = DMI- /TR
Note I used 14 period so the calculation is for the 14 days period
Where TR is true range for the day and we can also calculate that also.
To calculate the true range which is the greater between the highest and the lowest of the day. We can calculate this by subtracting the lowest to the day from the highest of the day that will give use the range. True range(TR)= the highest for the day - the lowest for the day and also we can also say the high for the day minus the close for the day TR= highest for the day - close for the day. Conversely, we can say that the TR= Lowest for the day - the close for the day
ADX Curve
To calculate the moving average of the ADX indicator. We will minus the -DI from - +DI amd also we will add the two them divide the two result then we multiple the result by 100 since the moving average highest value is 100
Mathematically,
ADX = [(+DI - DI-)/(+DI + DI-)]×100
If the +DI has the highest number the trend is up but if the -DI is the highest number the trend will be down.
2. How to add ADX, DI+ and DI- indicators to the chart, what are its best settings? And why?
I will show the process required to add the ADX, DI+ and DI- to crypto chat on the metatrader4 app.
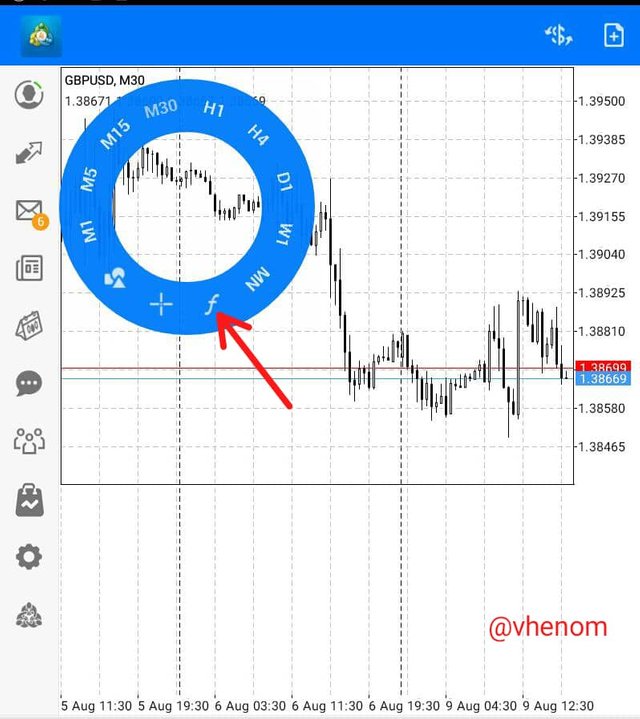
- After I have login my account on the metatrader4 app then i tap on the chart so it display a small circle where you can change the time of the chart and add indicator or if you want to draw on the chart I click on the f sign. See screenshot below.
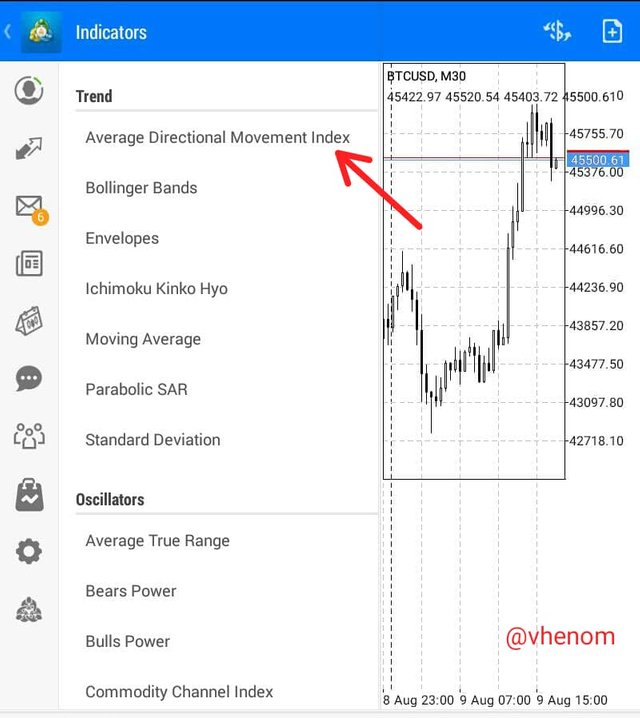
- After clicking on the f sign it shows all the indicators I just clicked on the Average Directional Movement Index
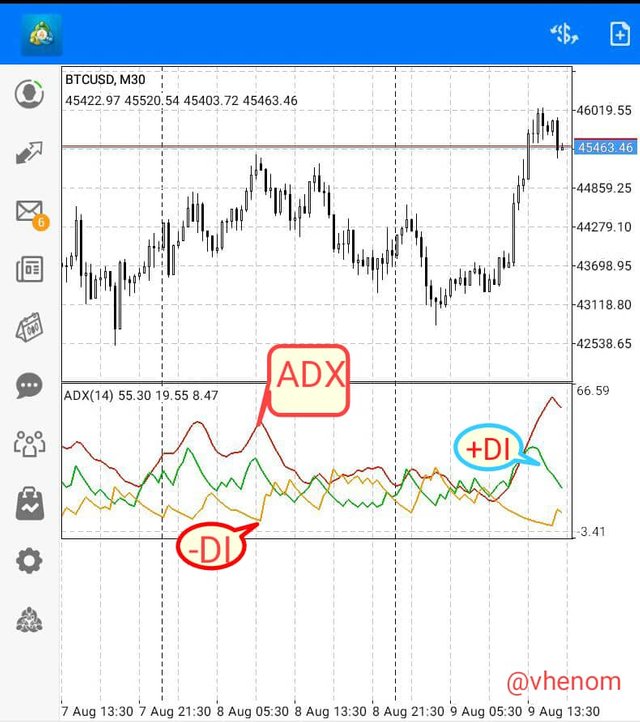
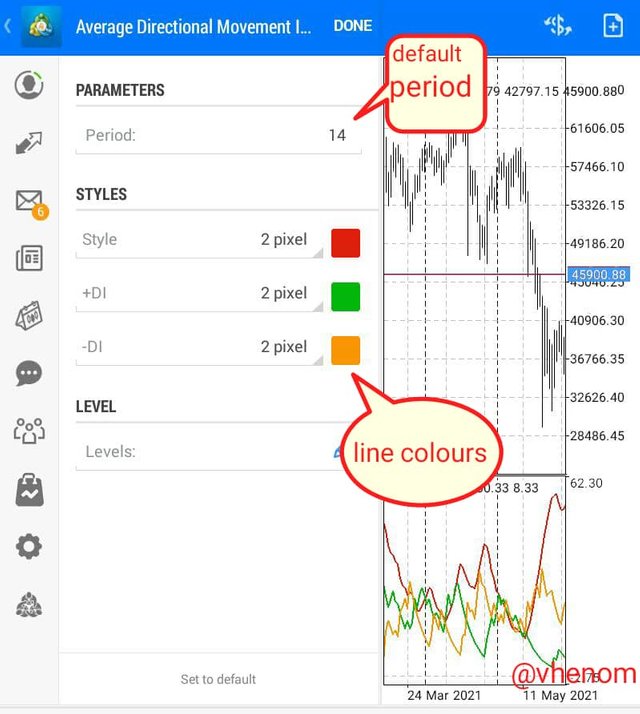
- It then shows the default settings of the indicator I edited the colour to my choice I use red for the ADX curve then green for the DI+ and orange for the DI-. The period remains the standard period which is 14 period.
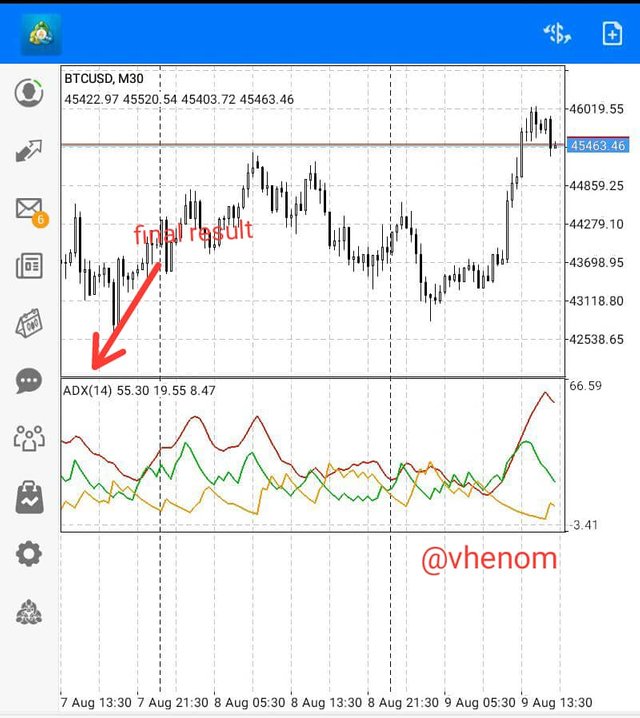
- After editing the settings I clicked on done then the indicator is added to the chart
 .
.
That's the process on how to configure the indicators on the chart on metatrader4 app.
What are the best settings for this indicators and why?
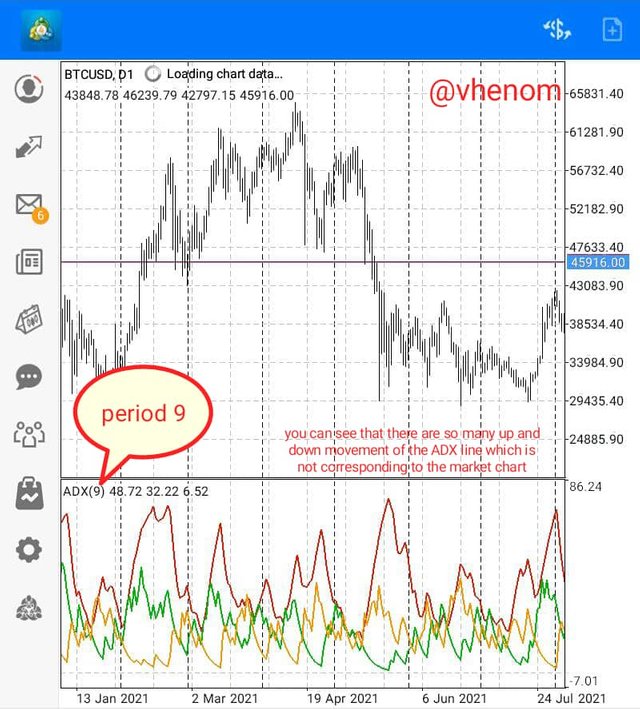
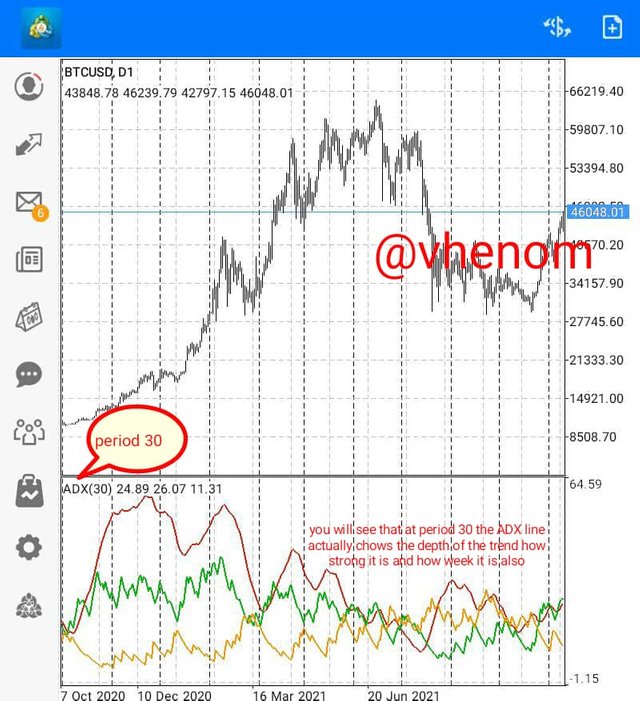
The best settings for the indicator is to set it to 14 period but some professional trader set to to their favourite choice. Any period that this indicator is seted it will only show the result for that period. For example if it is seted to 9 period it will display the chart of indicator for the past 9 period. If it is seted to lower period it will affect the way the indicator functions. The indicator might reads many false signal. Because sometimes it will be indicated that the trend is strong when using a lower period but when you check the chart it will be a different thing.
3. Do you need to add DI+ and DI- indicators to be able to trade with ADX? How can we take advantage of this indicator?
It is advisable to add the DI+ and DI- to the ADX indicator to be able to trade because the two line reads the trend in the market. This will give us a good impression when the ADX curve says the trend is strong. We can actually use the ADX curve alone to trade. But it gives late signals compare to when we add the DMI curve to the chart. The ADX curve is is lagging indicator.
When we add the DMI curve to the chart we can just use the ADX curve to determine the strength on the trend because the DMI curve will surely show the trend direction either bearish or bullish. And we won't get a fault signal because the ADX indicator will filter it out.
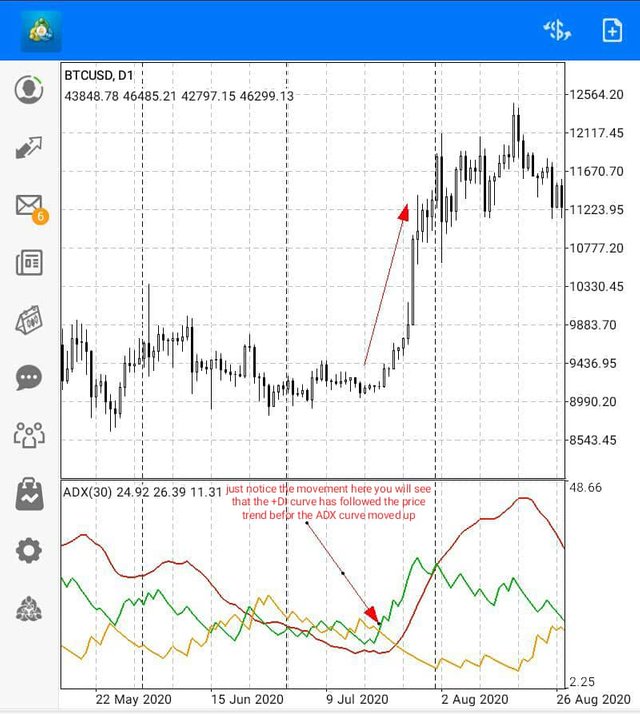
The DMI curve reacts faster to the price than the ADX curve because the ADX curve reads from the period set while the price has passed that period but the DMI follows the process it's detect the trend faster than the ADX curve. You see that the ADX curve gives a late signal.
4. What are the different trends detected using the ADX? And how do you filter out the false signals?
The ADX indicator is not an indicator that should be used alone in determining the trend of the market. We can use this indicator to confirm signals
- For identifying the trend range.
- For identifying the strength of the signal.
- As a filter for other indicator strategy.
For identifying the trend range
We can use this indicator to determine the trend range because this indicator ranges from 0-100. We target the curve around the 25 scale because that's when we have a valid trend. We see that there is a trend in the market already when the scale is in the 25 scale or above. Then I can say we have a signal here. It's now determined by the direction of the market.
Something we think if the ADX curve start coming down after a very strong signal that made the curve went up that it is a sign for reversal signal but we are wrong because the curve might just retrace small before breaking out again leading to continuation of the same trend.
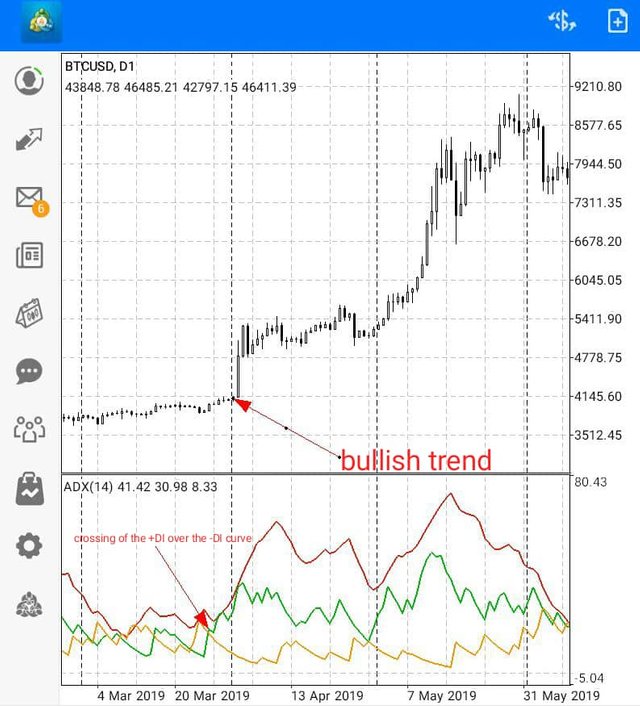
When we add the dimensional movement indicator to the ADX indicator it make the indicator easy to read. And we can get the trend of the market easily. And we can pick signal with the DMI curve. To get a valid signal, when the +DI curve crosses over the -DI then we have an uptrend we can pick that as our buy signal provided that the ADX curve is above 25 also indicating that there is a trend . And conversely when the -DI curve crosses the +DI curve and the -DI curve is above the +DI curve we the say that the trend will go bearish. We can only confirm this trend with the ADX curve I will say it is used to confirm a signal.
When the ADX curve is reducing we will notice that the trend is getting weak and the trend can get to the trading range anytime even before getting to the 25 scale.

For identifying the strength of the signal.
To identify the strength of the trend it's easy using the ADX curve because when the curve is around 25-50 we say we have a trend likewise if the curve is around 50-75 we say the trend is strong. With this curve we can determine how strong the trend is once it is within 50-100 we know the trend is strong. But the level at which this curve can get to will determine how strong/ the depth of the signal.
Another way to determine the strength of the trend is by looking at the peak the indicator can get. It will create higher high points. When it is high the trend will reverse a bit before it continues in its previous trend. This shows that the market trend is very strong. And also for a bearish trend the curve will create lower low points .

How to filter out false signals
Combining the moving average crossover strategy with the ADX indicator will help us to filter out false signals that are not supported by the ADX indicator. We have to confirm the trend with the range of 25 -50 where a trend is detected in the market. Then we will be sure that the trend is a strong one otherwise it is a false signal.not everytime that the dimensional movement indicator crossover each other that we see a change of trend. So we have to be careful in picking out signals. We should use the ADX indicator to pick the strong once. We can ignore all cross when the ADX indicator is below 25.
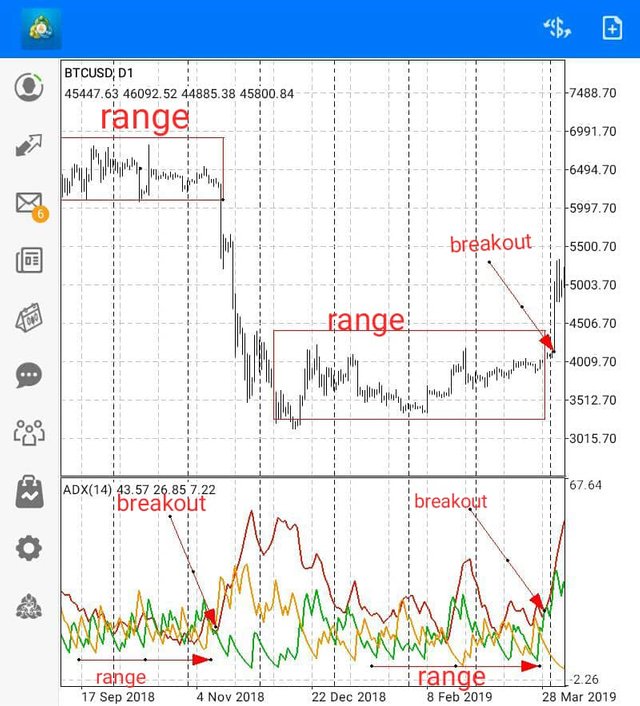
5. Explain what a breakout is. And How do you use the ADX filter to determine a valid breakout?
- Explain what a breakout is. And How do you use the ADX filter to determine a valid breakout?
We all know that breakout happen in the market so it not new to us when we see a breakout and most time a breakout leads to a trend reversal which deceive most traders because they pick the wrong one
But with the help of the ADX indicator we can filter out the false break out and we get to pick the right one when the set up form. We can neglect all breakout when the ADX indicator is below 25 scale.
When the ADX indicator is below 25 for a long time it shows that the trend is very weak or no trend and we know that the market can continue in a certain direction forever even for a range trend, a change in trend will occur sooner or later so when the ADX indicator moved for about 5-6 point up the scale we should know that the trend is about the change provided that the ADX indicator is above 25 after this move otherwise disregard it. This is known as a breakout because the trend is about to change from being in the range form to a real trend.
6. What is the difference between using the ADX indicator for scalping and for swing trading? What do you prefer between them? And why?
Firstly the difference between the swing trader and the scalping traders is that they trade in different time zone and a scalper will never be patient to get enough profit he runs with little or no profit at times.
So when trading with the ADX indicator as a scalper the first thing we needs to to do is that we should determine the trend of the market. After that we determine the resistance and support level . We can add and indicator to help us pick support and resistance level e.g the Ichimoku indicator so we can get our support and resistance level without stress. We will the add the ADX indicator on a 100 period since we are trading on a low time frame 1-5 mins o we can Skip any disturbance in the indicator. We then set out time frame between 1 - 5 minutes.
After setting the time frame we will the use the added indicator to determine our potential support or resistance. We will the check for a breakout in the trend. For. Long order we will check the added indicator to see if it's showing us signal for long and also the +DI must be above -DI and for a short order the -DI is above +Di. We won't trade if we receive signal from the Ichimoku indicator or any indicator added indicator is gotten when the ADX is below 25 it means that the ADX is not approving the signal. Even if the cross over occur when the ADX is below 25 point. But if the ADX indicator is approving our signal we can place an order.
This procedures can be used ba a swing trader all they need to do is to increase the time of trading and the can reset the ADX indicator to a default settings or 30 period. They have to change the time frame to 4 hours or 1day time frame. As a scalper we have to be disciplined with our reward and risk management. Because we are not scalping we just have to wait for a strong signal from both indicator I mean the ADX indicator and teh indicator we add to the chart (Ichimoku indicator). Before we can place an order.
The +DI must be above -DI and for a short order the -DI is above +Di. We won't trade if we receive signal from the Ichimoku indicator or any indicator added indicator is gotten when the ADX is below 25 it means that the ADX is not approving the signal. Even if the cross over occur when the ADX is below 25 point. But if the ADX indicator is approving our signal we can place an order.
CONCLUSION
ADX line indicates the strength of the trend. It doesn't matter if the trend is bullish or bearish. It determine the strength of both trend. Even when there is no trend in the market this line still shoe us that there is no trend or the trend is a weak one.The ADX line ranges from 0-100. With this range we know how strong the trend is or if there is no trend in the market chart.
- 0-25 when the Line is in this range it shows that there is no trend or the trend is very weak.
- 25-50 the line in this range shows that there is a trend in the market
- 50-75 the line in this range show us that the trend is strong
- 75-100 when the line is this high the ADX line is showing us that the trend is extremely strong. The Dimensional Movement Indicator (DMI) the DMI consist of both positive and negative line +DI and -DI this lines are use with the ADX line so it will be easy to use. This two line shows the trend in the market because the ADX indicator is a lagging curve it shows late signal. But withe the combination of this line we are cool to go.
CC @kouba01
Hello @vhenom,
Thank you for participating in the 7th Week Crypto Course in its third season and for your efforts to complete the suggested tasks, you deserve a 4/10 rating, according to the following scale:
My review :
An article with under average content due to the absence of analysis for several aspects of the topic, and here are the details.
Your interpretation of the ADX indicator was weak due to the repetition of the same idea and your focus on it, which is the strength of the trend, as the rest of the information was unorganized due to the absence of a clear methodology. As well as the absence of an applied example of the method of calculating the indicator.
Your choice of high or low settings for the period used by ADX indicator you did not explain it well.
As for the third question, you did not answer it well, as it focused on the same idea as the first question.
The DMI makes it easier to read the indicator. The DMI shows the direction of the market. How it works is that it measures highs and lows over a period of 14, the ADX's default setting. It indicates the direction of the market. If the + DI is above the -DI, it means that the price is going up, in this case, the ADX measures the strength of the uptrend.
As for the fourth question, it contains many errors, as you compiled a set of information without a clear methodology.
Same problem with the last question where you revolve around the idea without providing clear answers.
Thanks again for your effort, and we look forward to reading your next work.
Sincerely,@kouba01
With all the notes I wrote and time I spent you still telling me they I don't explain well I sacrifice many things Dominican do this assignment now you are giving me 4/10 c'mon
My work is all based on what you wrote and now you saying I don't do well. When what's I did is based on what you thought