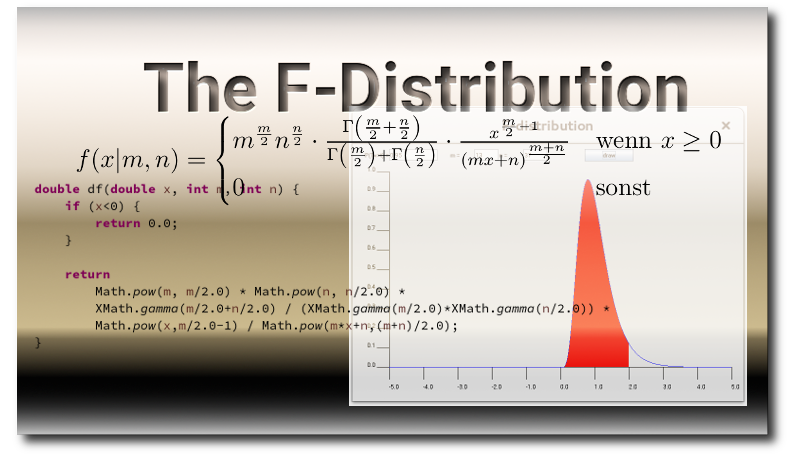
The F-Distribution - Compute and visualize in Java

Hello, I had little time because of my exam, but today I finished the already announced expansion of my program. In addition to the normal distribution and student's t-distribution, the F-distribution is now also included.
Restructuring of source code
The calculation of the gamma function has been moved to a new class for mathematical functions, which will be extended in the future.
public class XMath {

    final static double[] LANCZOSTABLE = {
             1.000000000190015,
            76.18009172947146,
           -86.50532032941677,
            24.01409824083091,
            -1.231739572450155,
             0.1208650973866179e-2,
            -0.5395239384953e-5
        };
        final static double LN_SQRT_2_PI = 0.91893853320467274178;

        /**
         * Callculating Gamma using the Lanczos method
         *
         * @param x
         * @return logarithm of the Gamma function
         */
        static double ln_gamma_lanczos(double x) {

            if (x < 0.5) {
              return Math.log(Math.PI / Math.sin(Math.PI * x)) - ln_gamma_lanczos(1.0 - x);
            }

            x = x - 1.0;
            double sum = 0;
            for(int i=1; i<LANCZOSTABLE.length; i++) {
                sum += LANCZOSTABLE[i]/(x+i);
            }
            sum += LANCZOSTABLE[0];
            return ((LN_SQRT_2_PI+Math.log(sum))-x-5.5)+Math.log(x+5.5)*(x+0.5);

          }

        public static double gamma(double x) {
            return Math.exp(ln_gamma_lanczos(x));
        }

}
New variables
    int m;
    int n;
Changes in the GUI
            labelM = new JLabel();
            labelM.setText("m = ");
            labelM.setBounds(200, 10, 75, 25);
            jPanel.add(labelM);

            textFieldM = new JTextField();
            textFieldM.setText("3");
            textFieldM.setBounds(250, 10, 50, 25);
            jPanel.add(textFieldM);

            labelN = new JLabel();
            labelN.setText("n = ");
            labelN.setBounds(300, 10, 75, 25);
            jPanel.add(labelN);

            textFieldN = new JTextField();
            textFieldN.setText("6");
            textFieldN.setBounds(350, 10, 50, 25);
            jPanel.add(textFieldN);
Calculation of the distribution
    double df(double x, int m, int n) {
        if (x<0) {
            return 0.0;
        }

        return
            Math.pow(m, m/2.0) * Math.pow(n, n/2.0) *
            XMath.gamma(m/2.0+n/2.0) / (XMath.gamma(m/2.0)*XMath.gamma(n/2.0)) *
            Math.pow(x,m/2.0-1) / Math.pow(m*x+n,(m+n)/2.0);
    }

    public double qf(double alpha, int m, int n) {
        double sum = 0;
        double pos = -1000;
        double stepSize = 0.01;
        while (sum<alpha) {
            sum += df(pos, m, n)*stepSize;
            pos += stepSize;
        }
        return pos;
    }
The chi-square distribution will follow in the next days. And also the simultaneous representation of different distributions is still on the way.
Nice! What IDE do you use? Eclipse? NetBeans?
Hi, at the moment I mainly use Eclipse, but more and more the IntelliJ IDEA.