The New Normal - US Stocks Rally Higher Despite Stagflation Arriving In The US
Very Bad News = Very Good News For Stocks
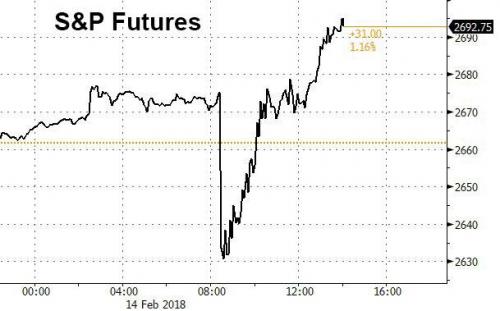
Overnight the US market for stocks put on a show, shaking out most likely many retail and professional traders out of their long or short positions with losses. Why you ask, well this was because we had another wild ride after the CPI numbers for the US came out.
The S&P 500 fell some 40 points after the announcement as the market digested a barrage of bad economic news (which will be covered later), only to finish at the end of the day close to the highs around 2700. Which was around 60 points higher from the futures low print.
The Market Continues On Trend To Higher Prices
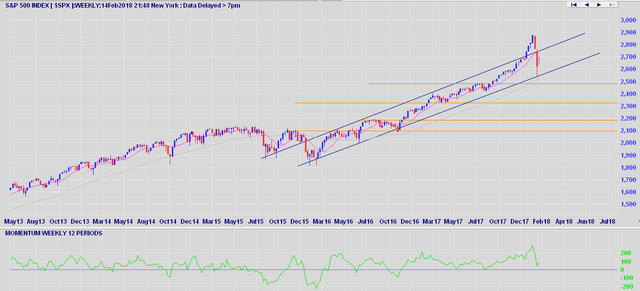
The recent sell off in US stocks we witnessed over the last 2 weeks looks set to be only a minor correction along its long term uptrend. If you take a look at the weekly chart below the S&P 500 over shot its up trend channel, only to reverse and hit the lower level of the uptrend channel last week before recovering.
The reason why I say this is based on how the market is reacting to the bad news of a slowing economy, with rising CPI numbers from the Government which is the definition of Stagflation. Stocks are moving higher anyway ignoring all economic reality.
This new normal is puzzling many experienced players in the market, because years ago you would of witnessed the market tanking of the threat of higher rates required by the FED to slow down inflation. The market instead is coming to realization that the FED will be ignoring the inflation and may back of on rate rises as the economy weakens.
The US Economy Is Slowing
Up until recently retail sales has been strong over the last few months. The consensus forecast before the announcement was for retail sales to be up 0.2%, after being flat the previous month. Instead the results came out with a -0.3% fall seasonally adjusted which was a big miss on forecasts.
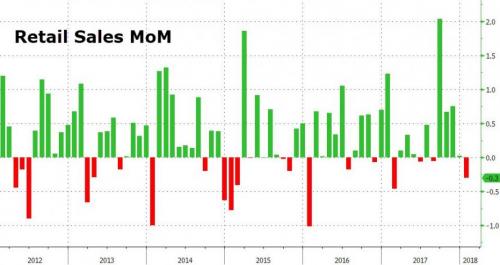
Why The Weakness In Retail Sales?
When your wages adjusted for inflation is falling its hard to go out spending, especially when you have large amounts of debt as a consumer.
From the chart below you can see that wages growth has been weak for several months now with falls or flat month in growth for real wages recently.
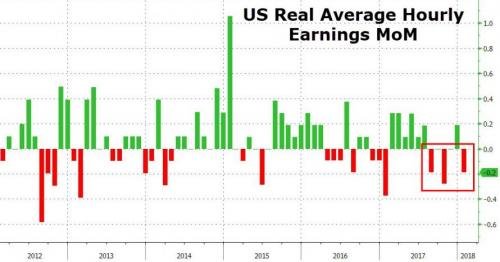
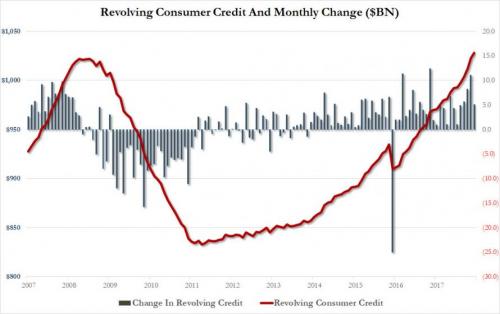
This economic results is even more concerning considering that the average consumer is broke as they have been funding the loss of purchasing power with huge increases in consumer debt.
The chart below shows that this trend has been moving rapidly higher since crashing in 2009, with consumer credit now back above 2007 & 2008 levels.
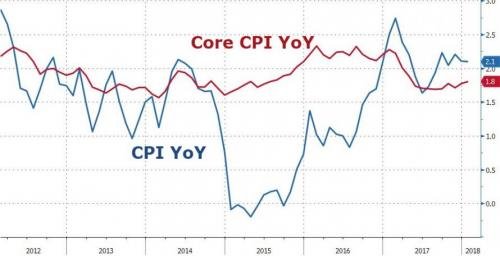
Both core CPI & CPI Y/Y growth has been edging up closer to the Federal Reserve target range of 2% inflation, which is one of the reasons why real wages has been struggling now for close to 6 months as any growth in wages is eaten away from CPI increases.
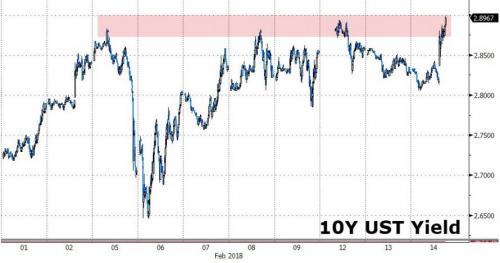
The US 10 Year Govt Bond Yield In The Danger Zone
Due to high inflation / CPI numbers coming in overnight with a 0.3% rise month on month with the core CPI, the US 10 year yield skyrocketed 6 basis points to close at 2.9% level.
As the 10 year yield rises closer to the 3% level, its going to significantly harm many aspects of the economy. This is because the growth in US GDP has been propelled from the large increases in debt from consumers, companies and the Government.
With higher yields servicing the debt becomes a bigger challenge, as what was a tail wind for the economy when rates were low now becomes a big head wind slowing the economy with Government 10 year yields edging closer to 3%.
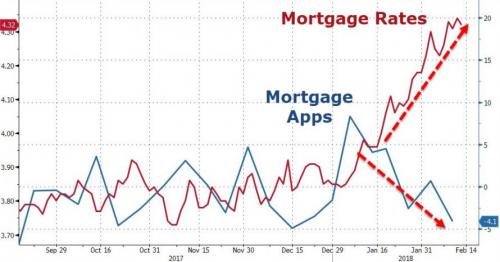
Higher Bond Yields Pushes Mortgage Rates Higher
The 10 year Government bond yield is utilized as the bench mark for pricing all debt products on the market, so its no surprise to see mortgage debt interest rates soaring as it following the 10 year yields trend higher.
The interesting thing is that with higher rates it becomes more difficultly for the average consumer to finance a new or existing property purchase. In the chart below you can see mortgage applications has dramatically slowed in recent months as higher rates sap demand and confidence in property. With slowing mortgage application this will be another drag on the US GDP in coming quarters as new home sales likely to slow in coming quarters.
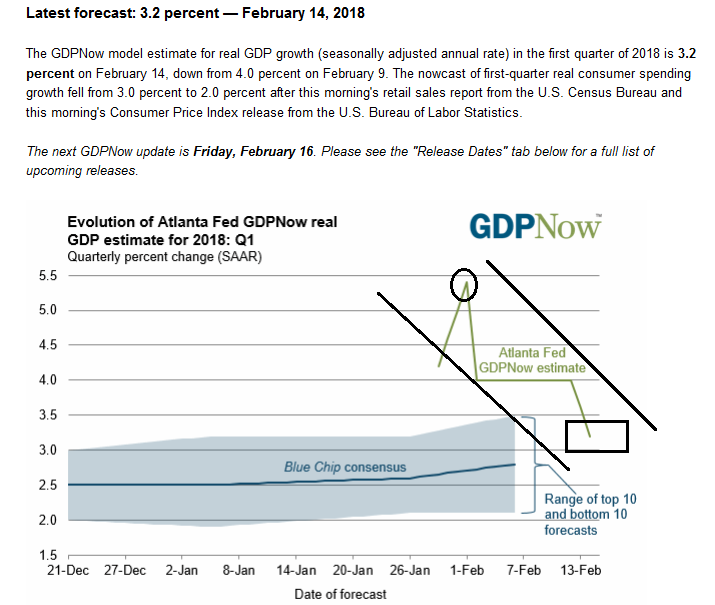
The GDP Trend Is Heading A Lot Lower
In late January the Atlanta FED GDP forecast team had predicted the next quarter GDP for the US economy to come in at a blistering 5.4% annual pace. Well in only 2 weeks since that high forecast the same Atlanta FED have been forced to lower their GDP forecast to 3.2% which is a big drop from the previous 5.4%.
Based on the trend of higher yields and the reliant of debt to fuel the economy I believe it wont be too much longer before we see a 1 in front of the GDP forecast as more economic news starts to come in over the coming weeks.
Happy trading and stay CALM.
Thanks for viewing this post

Disclaimer: This post is for educational purposes only, and all the information contained within this post is not to be considered as advice or a recommendation of any kind. If you require advice or assistance please seek a licensed professional who can provide these services.
Sources:
Incredible Charts
GDP Now
Zerohedge
Click the links below to view my latest Steemit posts:
Did You Take Advantage Of The Mini Rally In Crypto's?
Bitcoins Capitulation Confirmed - Bounces Off Support As Cryptos & Stocks Rally Higher
The Markets Are In A Panic - Are We Close To A Capitulation In Stocks & Bitcoin?
Sydney Real Estate Investors Are In For A Rude Shock As The Market Finally Cools Down
Thorough post. Thanks for your research. Where did you find the charts?
Thanks for your feedback. I have the links in the post. The weekly chart is from incrediblecharts.com software. Is that the chart you were referring to. Otherwise the majority of the others are from zerohedge. Cheers