TIB: Today I Bought (and Sold) - An Investors Journal #508 - Lithium, Electric Vehicles, Car Rental, Uranium, Europe, Satellite Communication, Semiconductors, Industrials, US Retail, Europe Banks, Crypto, Soybeans and more
Markets appear to be in two minds about Covid-19. They want to go up but they are a little nervous. Trade action in the week is mostly about looking for stocks that are breaking out from lows and following the Tesla momentum into lithium. Sales action is profit taking time with only part of the proceeds reinvested - I will start piling up a little more cash.

Portfolio News
Market Rally
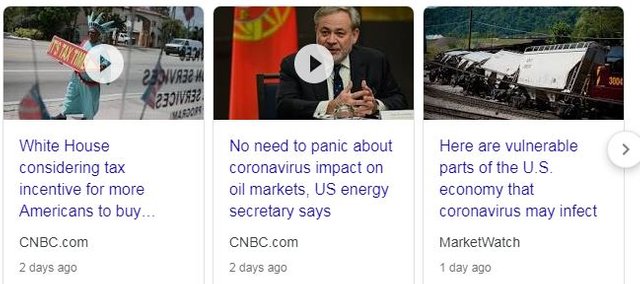
US markets continue to eke out new highs with an eye being kept open on the Covid-19 virus impacts.
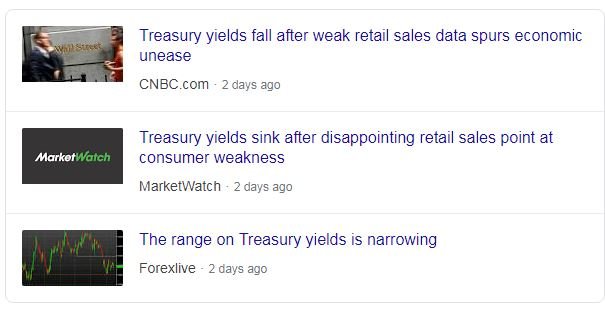
Bond markets are a little more nervous with yields drifting lower.
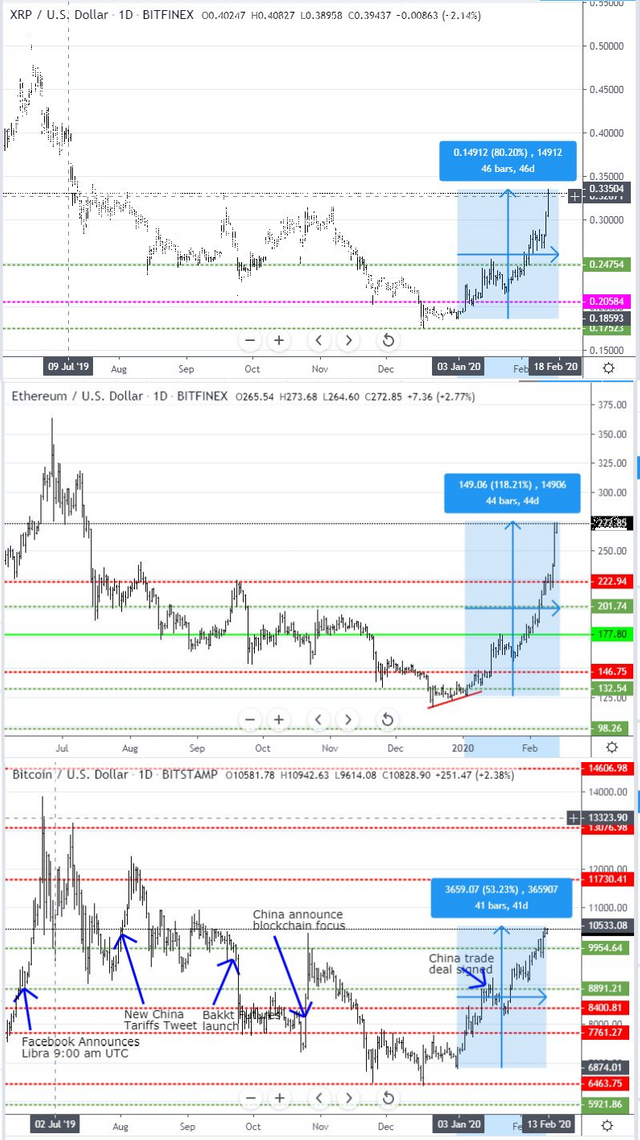
Cryptocurrency soars with Ethereum leading the charge. SteemDollars (SBD) spike 57% with the news of Tron taking over Steemit.
Bought
Global X Lithium & Battery Tech ETF (LIT): Lithium. Added to one portfolio to replace Renewable Energy ETF (RENW) closed down by ETF provider.
Livent Corporation (LTHM): Lithium. Keep averaging down - one small parcel at a time and writing the same covered call (12.5). This has bounced nicely in the week with all trades now profitable
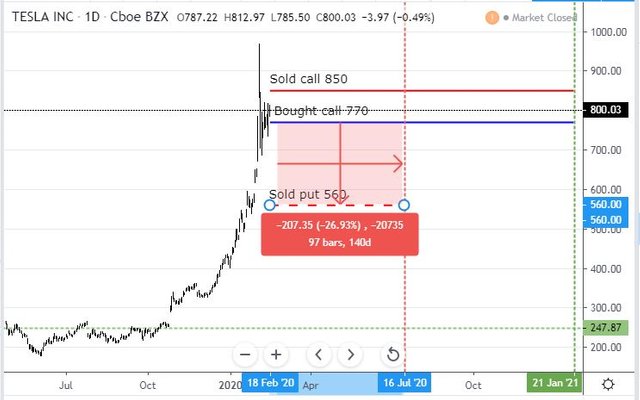
Tesla, Inc (TSLA): Electric Vehicles. The talking heads were on about Tesla in Monday's CNBC Closing Bell show. Price action since earnings indicates a step change in the way the market is looking at the business - this is part of a revolution. I started to look at options chains. How about grabbing a call spread for a 10% move up in price - say $770 to $850 which is below the February 5 $887 high. Given price has been this high already, no need to go too far out in time. How about January 2021 (11 months)? That came in at a net premium of around $35 which is 4.5% of bought strike. How much protection can one get for that premium by selling a put. Is 38% enough for 5 months? And that becomes the telling question. Price was below $560 on January 22 - a short 18 days ago. Would one be happy to buy at $560 is the real question. The Tesla China factory did reopen this week.
So that is what I bought - a January 2021 770/850 bull call spread with a net premium of $28.65. That offers maximum profit potential of 179% on its own for a 10% move up in price from the $771.28 open. Note that the bought call is in-the-money. I funded that spread by selling a July 2020 strike 560 put option for a premium of $38.52 - i.e., I was given $987 after trading costs. Risk in the trade lies in price falling 48% to $521.48.
Let's look at the chart which shows the bought call (770) as a blue ray and the sold call (850) as a red ray and the sold put (560) as a dotted red ray with the expiry dates the dotted green and red vertical lines on the right margin.
This is almost a blue sky situation. The market has clearly re-rated the stock from the long trading range it was in until late 2019. The gap down to the sold put looks sizeable enough. The sold call level (850) is well below the highs made around earnings. And it was a free trade
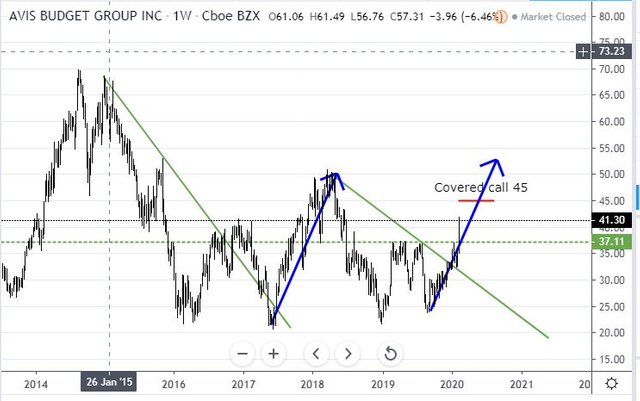
Avis Budget Group, Inc (CAR): Car rental. CNBC Last Trade idea premised on appointment of a new Chairman who bought a huge pile of stock. Bought a small parcel and sold a covered call at 45 strike (1.14% premium with 16% coverage). Chart shows a break out of the weekly downtrend and sure shows that this stock can move as hard as it has just done
Cameco Corporation (CCJ): Uranium. Price has moved over the top of the covered call strike I had written (9). Bought another holding with a view to averaging down and to write a March covered call. Trading error got me selling a March 10 strike put instead of the call = ouch as the put is in-the-money. Have put in a pending order to close it out and hopefully only lose trading cost - that worked.
WisdomTree Coffee (COFF.L): Coffee. Price has reached lows from the previous cycle down. Averaged down with a small holding. I will keep adding if price does not hold this level.
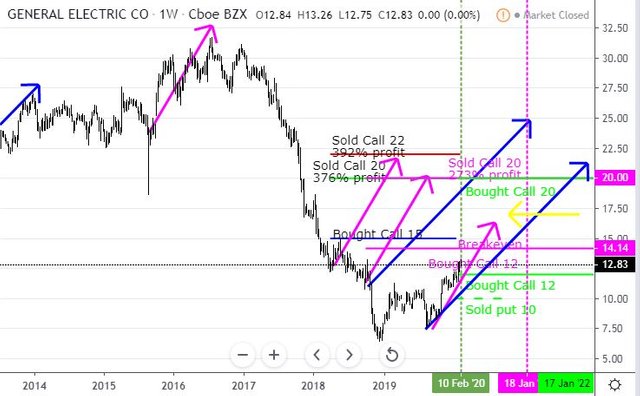
General Electric (GE): US Industrials. Jim Cramer idea to average down. Also added an October 2020 14/17/10 call spread risk reversal. The net premium on the 14/17 bull call spread was $0.78 which offers a maximum profit potential of 284% for a 29% move up in price from the $13.16 close. Adding the sold put levers up the potential to 512% but it does introduce risk if price drops below $10 at expiry. Breakeven for the trade is $14.49 - 10% up on the close.
I have a few trades open on GE. The updated chart shows the target level and expiry for this trade at the point of the yellow arrow. If price continues on the pink arrow price scenario it is on it will make the maximum.
Credit Agricole S.A. (ACA.PA): French Bank. Prices have been recovering across French banking sector. Deployed portion of profits from Allianz sale (see below) to average down a December 21 strike 14 call option. This new trade needs a 10% move from close of €13.54 to break even.
JC Penney (JCP): US Retail. Price has cycled back to prior lows - looking for a rebound into the summer season as a trading idea. Does average down an existing holding.
AbbVie Inc. (ABBV): US Pharmaceuticals. CNBC Last Trade idea as price has basically not moved all year and drug pipeline will change with the integration of Allergan business. This is a Jim Cramer Actions Alerts portfolio holding. I added another 50 shares to be able to write covered call (1.16% with 4.6% coverage for 5 weeks)
Sold
NVIDIA Corporation (NVDA): US Semiconductors. Closed at 52 week high for 88% profit since May 2019. I did write naked put for March expiry at a 240 strike after this sale was made (0.3% premium for 17% coverage).
Iridium Communications Inc (IRDM): Satellite Communication. Sold partial holding in one portfolio at 52 week high for 15% profit since April 2019.
Eurostoxx50 (ESTX50): Europe Index. With price trading at 3829 closed out a December 2024 3500 strike call option. My brokerage account was telling me the holding was positive. Accounting system tells me there was a 10% loss. How does that happen? Some time back, the brokerage (Interactive Brokers) migrated accounts from UK regulation to Australian regulation. In the process, I figure, they transferred holdings across at market value and not at book value. Ouch!!
That said, I have grown tired of waiting for Europe to sort itself out.
Allianz SE (ALV.DE): German Insurance. With price opening at €229 closed out December 2021 strike 220 call option for 28% profit since June 2019. I do retain one out-the-money call option.
salesforce.com, inc (CRM): Cloud Computing. Profit taking sale for 58% profit since November 2018 - a Jim Cramer idea to buy. He is still holding.
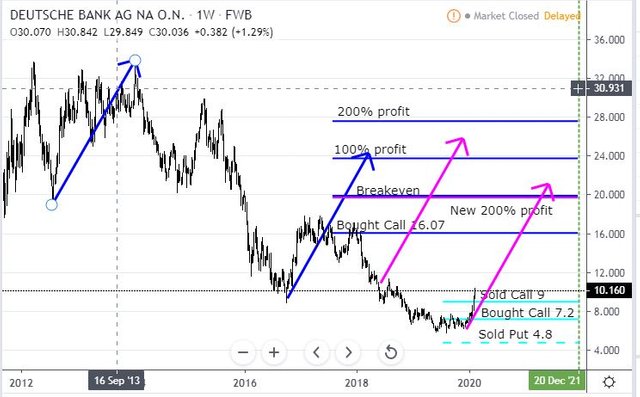
Deutsche Bank AG (DBK.DE): German Bank. With price closing over €10, closed out a December 2021 7.2/9/4.8 call spread risk reversal. Profit on the call spread alone was 109% and selling the 4.8 put levered this up to 177%. The trade was a cash neutral trade. I must say I was surprised to see a trade setup in July 2019 hit the maximum so soon. This trade was set up while I was travelling last July - so no write up to go back to. But the chart does show what I saw (the closed trade in light blue) - price breaking a downtrend and confirming a bottom.
Now I have cloned across a pink arrow price scenario - there is still hope for the 16.07 call option if this plays out.
Soyabeans Futures (SOYB): Soybeans. Keep dipping back to trade reversals off 4 hourly chart - 2 trades closed for average $3.10 per contract profit (0.35%) one on trailed stop loss and one actively closed just before market close. Slowly I am recovering the losses on other open positions.
Income Trades
6 covered calls written some with March expiry at average premium of 0.97% and coverage of 6.75%. This brings the average for the month to 1.47% and 8.40%
Naked puts written on NVIDIA Corporation (NVDA)
Cryptocurency
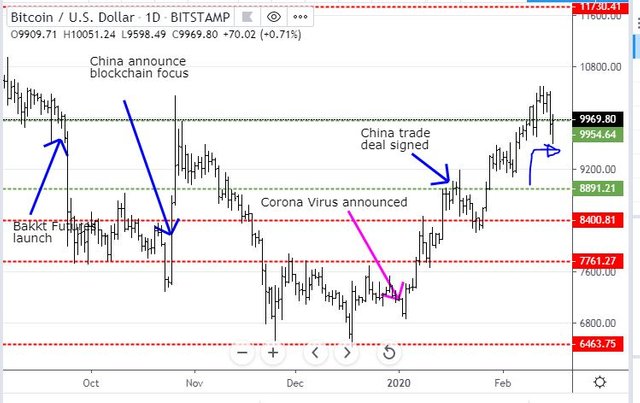
Bitcoin (BTCUSD): Price range for the week was $902 (8.9% of the open). Price tested support at $9954 to start the week and pushed higher through $10,000 but could not hold the higher high in weekend trade.
5 trades opened and closed in the week on trailed stop losses for average $308.33 per contract profit (3.12%)
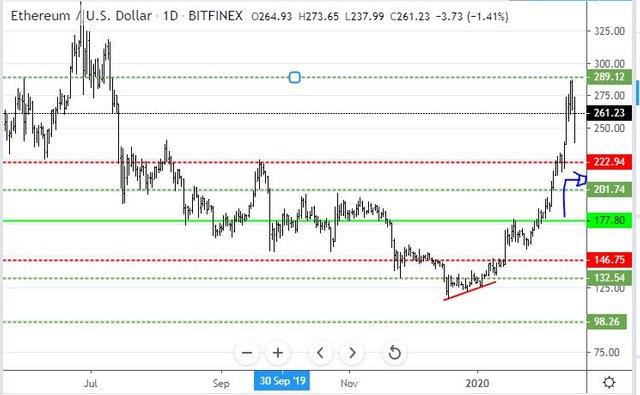
Ethereum (ETHUSD): Price range for the week was $71 (32.8% of the open). Price tested resistance at $222 to start the week and then raced to test resistance at $289 before falling back to $250 round number.
3 trades opened and 4 closed in the week on mix of trailed stop losses and profit targets for average $32.78 per contract profit (15.3%). Longest standing contract from November 2019
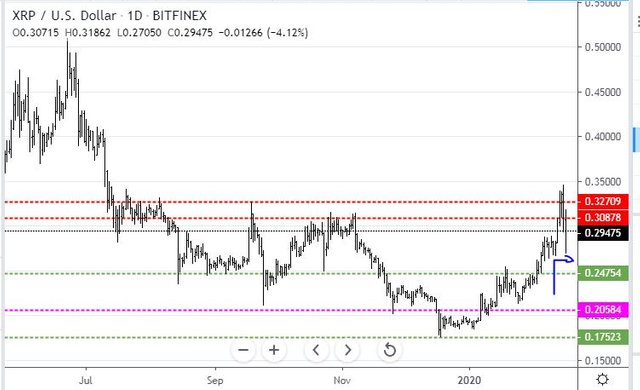
Ripple (XRPUSD): Price range for the week was $0.07919 (28% of the open). Price pushed lower to start the week and then raced ahead in the same way ETH did going straight through the $0.30 and $0.32 round numbers breaking resistance at $0.32709 before falling back.
The streak up in price took out profit targets on the round numbers at $0.29, $0.30, $0.32 and $0.33 with 8 trades closed at average $0.0173 per contract profit (6.05%) with all but one trade opened during the week
CryptoBots
Profit Trailer Bot No closed trades. Somehow the bot has exceeded bandwidth limits on the VPS. I am guessing this is because the updated software has a bug in the way it is reporting errors. (There is an error in an entry price target which I have not solved)
Pending list remains at 8 coins
New Trading Bot Trading out using Crypto Prophecy. No closed trades
Currency Trades
Outsourced MAM account Actions to Wealth closed out 6 trades on AUDNZD for 0.79% profits for the week. No trades open
Cautions: This is not financial advice. You need to consider your own financial position and take your own advice before you follow any of my ideas
Images: I own the rights to use and edit the Buy Sell image. News headlines come from Google Search. All other images are created using my various trading and charting platforms. They are all my own work
Covid-19 badge from CDC is free to use https://www.cdc.gov/coronavirus/2019-ncov/communication/buttons-badges.html
Tickers: I monitor my portfolios using Yahoo Finance. The ticker symbols used are Yahoo Finance tickers
Charts: http://mymark.mx/TradingView - this is a free charting package. I have a Pro subscription to get access to real time forex prices
Bitcoin: Get started with mining Bitcoin for as little as $25 http://mymark.mx/Galaxy
February 10-16, 2020



Congratulations @carrinm! You have completed the following achievement on the Steem blockchain and have been rewarded with new badge(s) :
You can view your badges on your Steem Board and compare to others on the Steem Ranking
If you no longer want to receive notifications, reply to this comment with the word
STOPTo support your work, I also upvoted your post!
Do not miss the last post from @steemitboard:
Vote for @Steemitboard as a witness to get one more award and increased upvotes!
Hi, @carrinm!
You just got a 0.32% upvote from SteemPlus!
To get higher upvotes, earn more SteemPlus Points (SPP). On your Steemit wallet, check your SPP balance and click on "How to earn SPP?" to find out all the ways to earn.
If you're not using SteemPlus yet, please check our last posts in here to see the many ways in which SteemPlus can improve your Steem experience on Steemit and Busy.