TIB: Today I Bought (and Sold) - An Investors Journal #392 - Corn, US Retail, Swiss Pharmaceuticals, US Healthcare
Markets get cheered by better China data. Trade action is limited to corporate action in pharma, a bullish view on corn and a bearish short term view on US Retail.

Portfolio News
Market Rally
Global markets reflected on the weekend and stepped up across the board
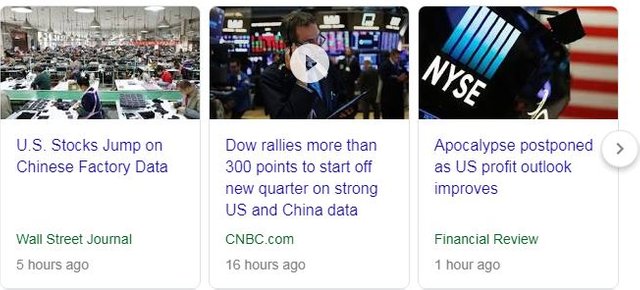
Mood was buoyed by better manufacturing data out of China and US (ISM data). The China data story is frustrating in the way markets reacted to February data. Lunar New Year is a huge drag on the China economy - market participants should know that and seasonal adjustments should fix the data. Neither happens.
Treasury yields rose and dragged financials stocks with them (especially banks)

Turkish Election
Erdogan suffers something of a setback in local elections in Turkey

Good news for portfolio holdings in Turkey, which are under water - the market quite liked the result. iShares MSCI Turkey ETF (TUR) up 2.22% for the day
Britain Bumbles
UK Parliament rejects all 4 proposals for a Brexit compromise - the Pound took a bashing.
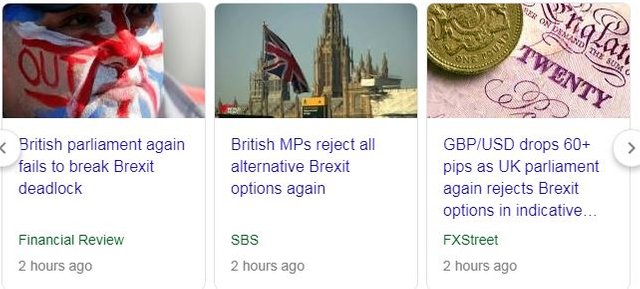
Two proposals got a lot closer - maybe there is light.
- Customs union with EU and reduced need for checks at Irish border = restricts ability to make trade deals outside EU. Theresa May opposes this idea. Only lost by 6 vote swing.
- Common Market 2.0: Join European Free Trade Association and European Economic Area, with countries such as Norway and Switzerland = remain in EU single market with freedom of movement. I doubt the EU will agree with this one.
Not much talk about budget contributions to EU. It's a mess and April 12 is 11 days away with a European Council scheduled for April 10.
https://www.bbc.com/news/uk-politics-47767627
Bought
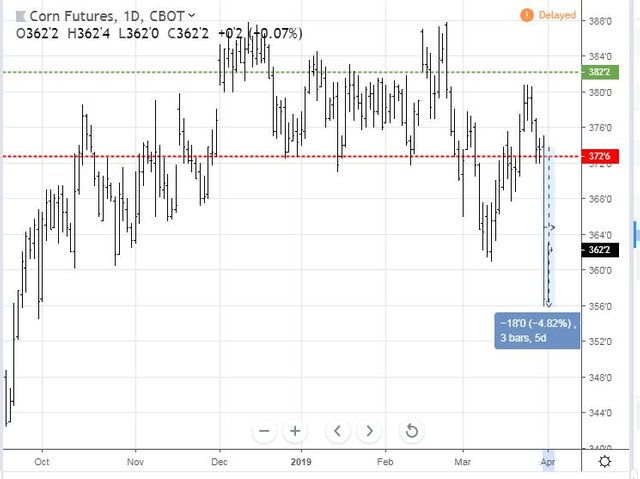
Corn Futures (CORN.L): Corn Futures. Bought another corn May futures contract on a reversal on the daily chart on Friday. Chart looks good with a reversal confirmed off a sold level (doted red line in chart below).
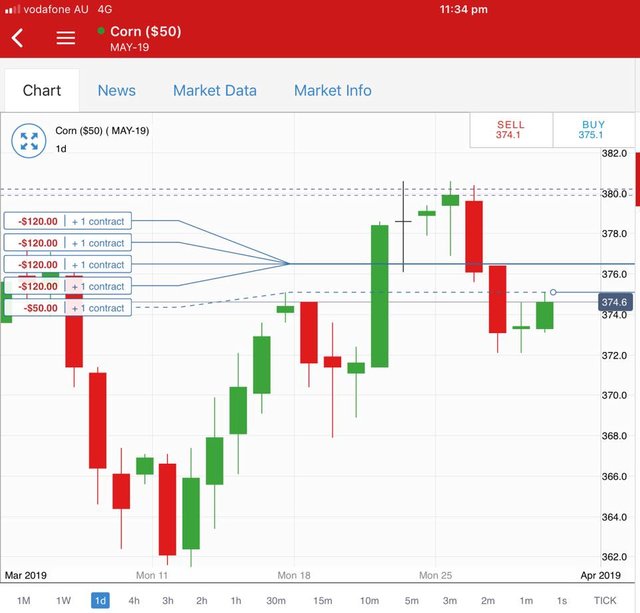
United States Department of Agriculture (USDA) releases corn report later that day which points to big increase in acreage planted to corn for the coming season. Price gets smashed 4.8% and margin calls come popping over the weekend.
This report feels like unintended consequence of the tariff war with farmers shifting away from soy beans (tariffed by China). The market reaction is extreme given that progress is being made on the US-China trade talks (and corn is an area China is committing to increase) and severe flooding in large parts of the corn belt likely to affect actual production
Sold
Novartis AG (NOVN.VX): Swiss Pharmaceuticals. Novartis is in the process of spinning off its eyecare business, Alcon, which will be listed in US and Switzerland from April 9. I was holding January 2021 strike 92 call options with a closing price of SFr 96.04. I have learned over time to close out options contracts when there is corporate action like this as liquidity in the revised options evaporates and the market pricing changes. I searched extensively to find what the process was going to be for the options - could not find anything. As they are European options I can only exercise on expiry. So I sold them for 67% profit since January 2019. This has been a highly profitable trade bought on the back of Trump's war on pharmaceuticals - a war that has not really begin.
Quick chart update from the rollup in January when this trade was opened (green ray).
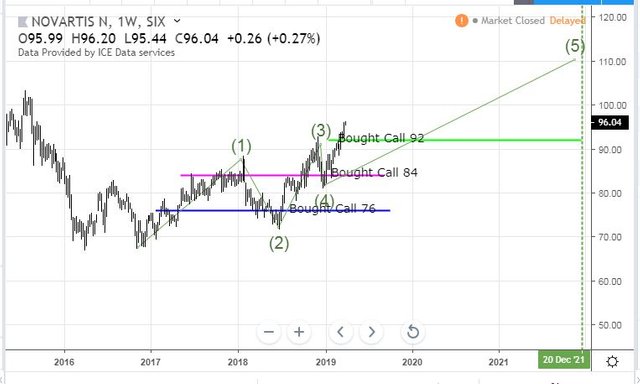
I had drawn in an Elliot Wave and estimated that price could reach SFR110 if the wave flowed through normal patterns. Price was certainly on a steeper trajectory. The spinoff changes the wave dynamic. I will review the remaining Novartis business once the new stocks are split and listed - my sense is the core pharmaceutical business is more growth oriented than the eyecare business.
Shorts
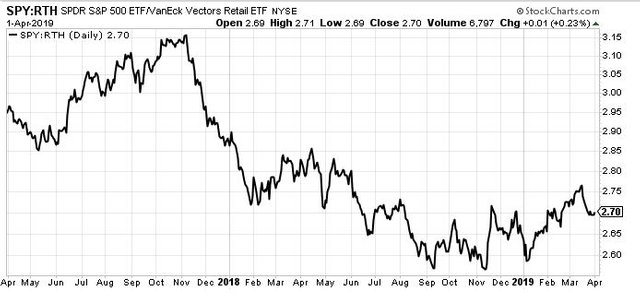
SPDR S&P Retail ETF (XRT): US Retail. Trade idea from CNBC Options Action team based on relative underperformance of US retail sector compared with wider market. The idea was to buy a May expiry 45/40 bear put spread against a Friday closing price of $45.01. First chart shows the buy:sell chart for XRT vs S&P500.
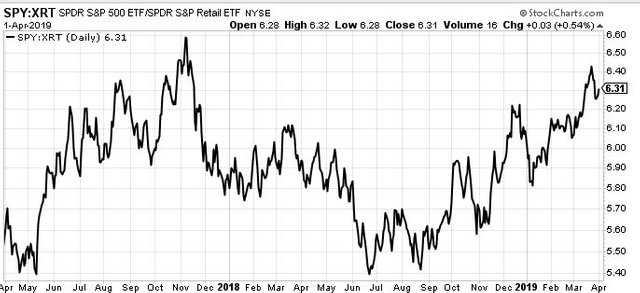
Buy:Sell Chart [Means: Buy the first named stock and sell the second named stock. If the chart goes up the first named stock is outperforming. If the chart goes down the second named stock is outperforming]
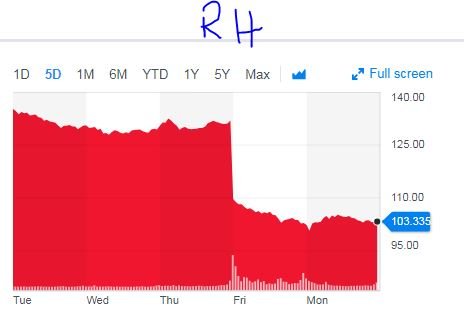
The sector has under-performed since mid 2018 and has not recovered as well from the December lows after the big selloff. Earnings season is over and next earnings begin around April expiries. The view was that any earnings surprises would be punished like the Restoration House (RH) earnings on Friday.
The trade premise is this under-performance will continue and earnings will push things lower. What they added was implied volatility was quite low making an options play cost effective compared to shorting the stock.
I had a look through the options chains and decided to keep the trade open ended by buying a May 2019 strike 44 put option for $0.75 premium (1.7% of strike) = same premium as the net 45/40 spread. I did explore all short term time frames (April, May and June). The chart is simple - hold the lower high and make a lower low and trade will make breakeven at least.
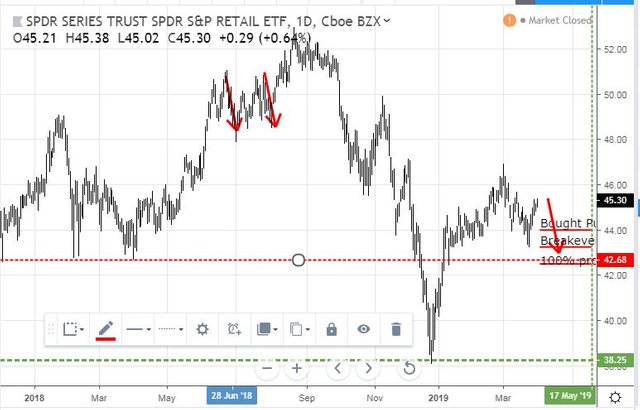
I have modelled the width of the last trading range and copied across to now (red arrows). Get a repeat of that size trading range and trade will make 100% profit. That level coincides with early 2018 lows (dotted red line).
XRT is an equal weighted ETF holding about 95 stocks - this makes it representative of the sector as a whole but not influenced by bigger players like Amazon (AMZN), Home Depot (HD) and Walmart (WMT). The market capitalisation weighted ETF, VanEck Vectors Retail ETF (RTH) has a quite different buy:sell chart - it has out-performed until Q3 2018 and then tracked sideways . It does not have any options liquidity. [Note: Amazon is 20% of this ETF]
Income Trades
CVS Health Corporation (CVS): US Healthcare. Strike 59.5 covered call expired with closing price at $53.93.
Cryptocurency
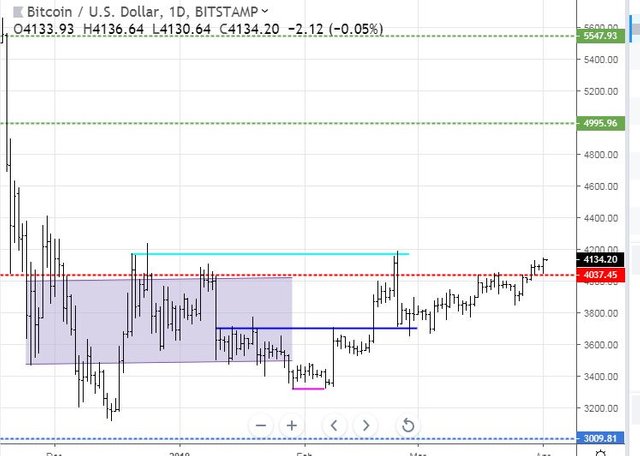
Bitcoin (BTCUSD): Price range for the weekend was $145 (3.6% of the low). Price finally broke out of the $3500 to $4000 trading range it has been in since mid December 2018. It has now broken above the resistance level at $4037 and held there for 3 days. Next resistance level is around $4160 (light blue ray) with a lot of blue sky above that.
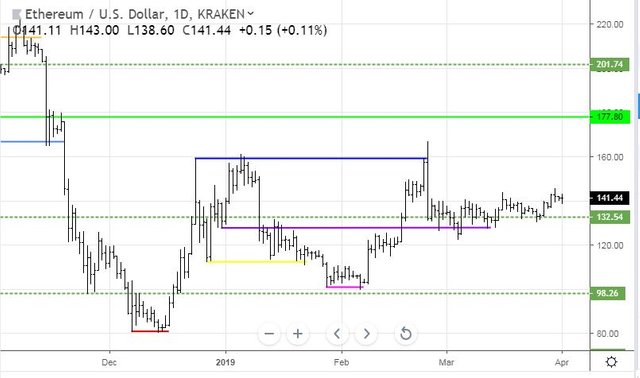
Ethereum (ETHUSD): Price range for the weekend was $9 (6.6% of the low). Price made a higher high on March 30 followed by an inside bar. Monday's bar is an engulfing bar with momentum suggesting a push to another high.
CryptoBots
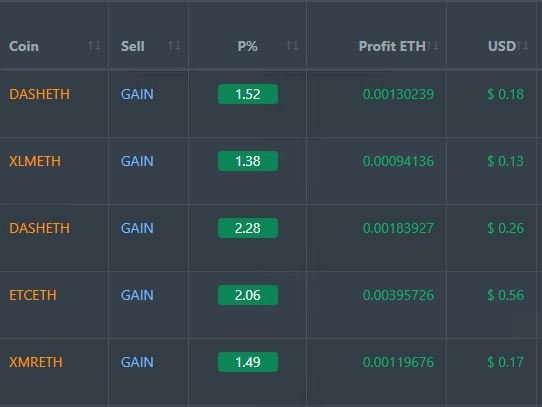
Profit Trailer Bot Five closed trades (1.75% profit) bringing the position on the account to 7.33% profit (was 7.17%) (not accounting for open trades). Adding DASH and XMR to whitelist helped with winning trades on both achieved.
Dollar Cost Average (DCA) list remains at 3 coins
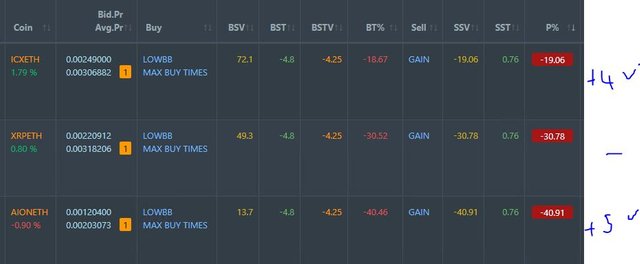
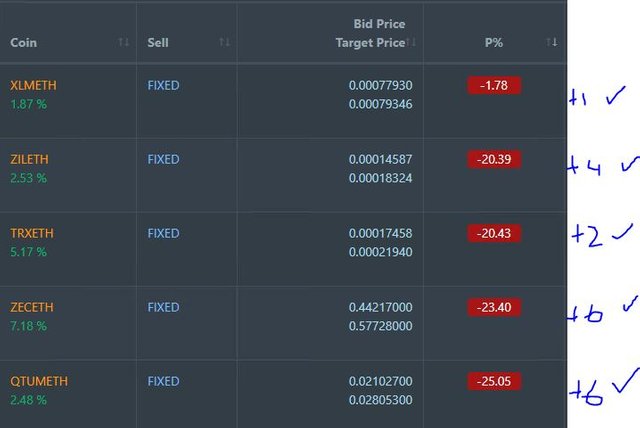
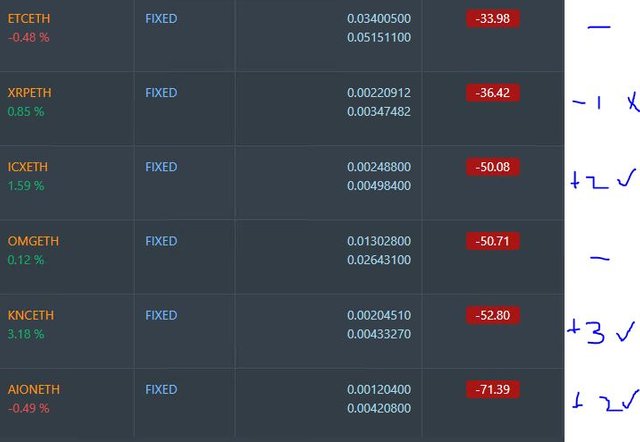
Pending list remains at 11 coins with 8 coins improving, 2 coins trading flat and 1 worse.
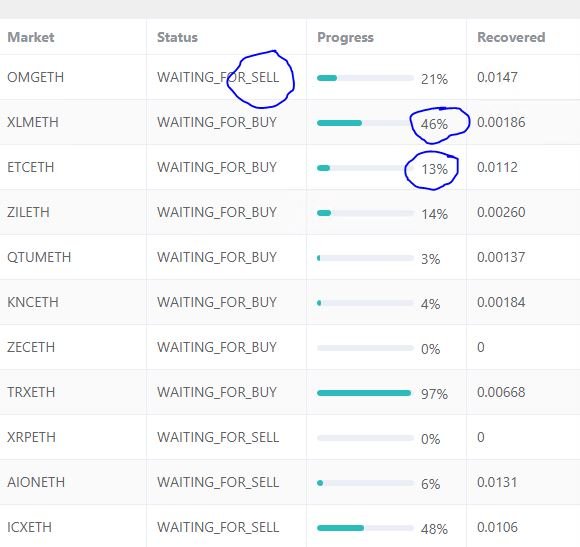
PT Defender continues defending 11 coins with successful defence trades on XLM and ETC.
New Trading Bot Trading out using Crypto Prophecy. No closed trades. Converted a small USDT balance to ETH - before the price spiked over the weekend. This allows me to increase trade size. Trades remain open on XLM, SC and VET.
Currency Trades
Outsourced MAM account Actions to Wealth closed out 5 trades on CADJPY, AUDNZD for 0.48% losses for the two days. One trade open on AUDNZD (0.21% negative). Must say I would not have been trading short CADJPY from a fundamental viewpoint - risk on (JPY falls) and rising oil prices (CAD rises).
Cautions: This is not financial advice. You need to consider your own financial position and take your own advice before you follow any of my ideas
Images: I own the rights to use and edit the Buy Sell image. News headlines come from Google Search. All other images are created using my various trading and charting platforms. They are all my own work
Tickers: I monitor my portfolios using Yahoo Finance. The ticker symbols used are Yahoo Finance tickers
Charts: http://mymark.mx/TradingView - this is a free charting package. I have a Pro subscription to get access to real time forex prices
Tracking: Keeping track of your crypto trades is a whole lot easier with CoinTracking.info. Get 10% off all your account upgrades https://mymark.mx/CoinTracking
March 29 - April 1, 2019

It feels as though the markets are about to have a big upside until more data comes out to confirm or reverse course. Earnings will be the first stop!
Posted using Partiko iOS
Agreed - unless Trump does something on his agenda. Auto tariffs. i am going to guess he waits until China is in the bank. He does measure results from the markets.