TIB: Today I Bought (and Sold) - An Investors Journal #369 - TV Streaming, US Healthcare, US Banks, French Banks, Marijuana
Nerves come back to markets especially Europe. Pullbacks give more chances to buy back into US healthcare and a neat way into TV streaming. A few more covered calls add to income for the month

Portfolio News
Market Jitters Return
Data weighed on markets with weak manufacturing in Europe and weak business investing and existing home sales in US
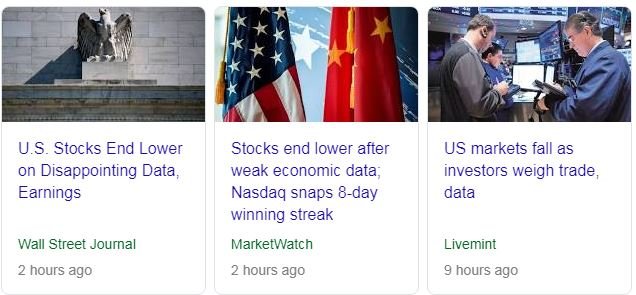
Maybe also investors had a day to digest the Federal Reserve minutes and it made them feel less good. The reason the Fed eased its stance was it was seeing softer data. Which is more scary? The Fed raising rates too much or softer data?
https://www.wsj.com/articles/global-stocks-pause-for-breath-after-recent-climb-11550741213
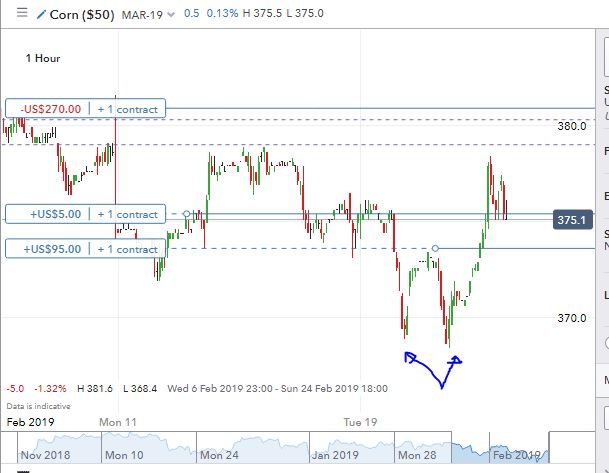
There does seem to be progress being made on China trade discussions with Donald Trump due to meet the head of the delegation on Friday. Biggest move was in agriculture - just look at the corn price gyrate (1 hour chart). Note the double bottom off a level (lines up with a low further back in time)
European markets led the softness compounded by problems in banking and some poor earnings
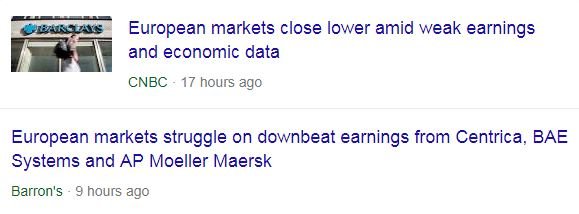
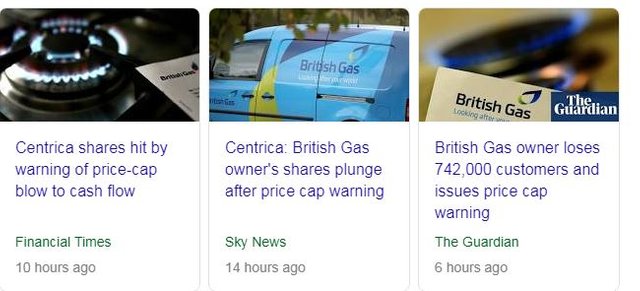
My UK portfolio holdings in Centrica and Barclays both reporting earnings gaps.
That said, European interest rate markets are looking a little toppy
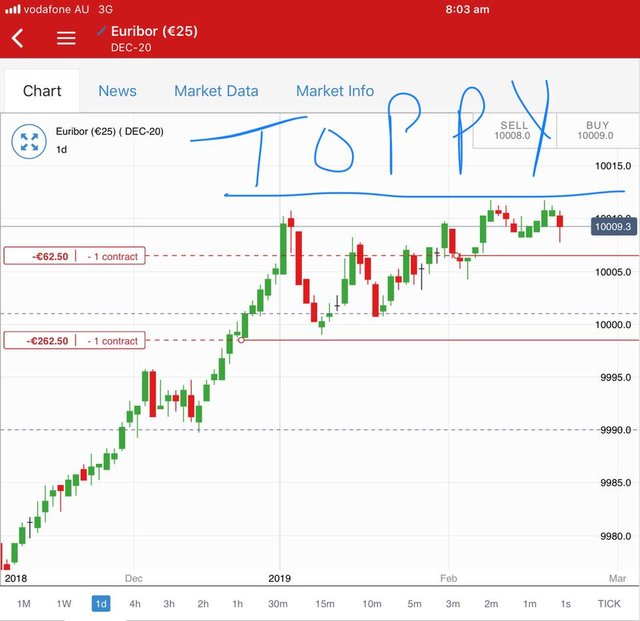
Note: this is a price chart. Rates rise when price falls.
Bought
Aurora Cannabis Inc (ACB.TO): Canadian Marijuana. Pending order in one of my portfolios taken up overnight.
CVS Health Corporation (CVS): US Healthcare. Well Jim Cramer was right. The selling did continue into a second day with price touching the $62 level. I added more shares in one portfolio. Jim Cramer view is that the long term rebuild for the business is compelling and priced at a price earnings multiple around 9 times, this is good value.
Roku, Inc (ROKU): US TV Streaming. Shares in Roku were assigned on a covered call in one of my accounts last week. I was keen to find a way to buy back in below the current price.
Roku were due to announce earnings after market close. 1st step was to sell an in-the-money March 2019 50 strike put option (7.3% below $53.64 opening price). My pending order was hit at market open for $2.98 premium (5.5% premium). I bought 2 contracts as I was happy to buy 200 shares. This opens up an effective 12% discount on the price buying back in. 2nd step: With market pulling down during the day and earnings due out after the close, I figured I could buy a one strike out-the-money call option (52 strike) for less than the sold premium. I bought a March 2019 strike 52 call option for $4.33 (8.4% of $51.48 close). This premium was less than the premium I received for the sold put.
Earnings were better than expected and price jumped over 5% in extended trade taking price above the bought strike - happy with that (green shading).
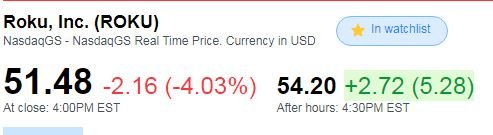
Feels like free money to me but is it? My net premium is -$1.63 which gives me breakeven on the bought call of $50.37 (i.e., $52 minus $1.63). If price stays above breakeven, I am in-the-money. If price drops below that but stays above $50, I get to keep the sold premium and I lose a bit on the stock. The risk in the trade is price drops below $50 and keeps falling.
How did this happen? Options traders were thinking earnings would disappoint and they jammed the price of puts higher yesterday when I put my bid in. Earnings shows that they were wrong.
How does that all look on a chart? The chart shows the bought call (52) as a blue ray and the sold puts (50) as a red ray with expiry the dotted green line on the right margin. Breakeven is dotted blue line.
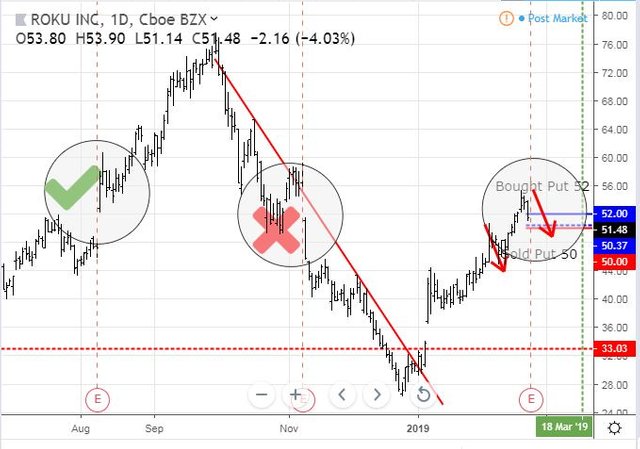
My trade idea was that earnings were going to be great and the outcome would be more like the left hand earnings (green tick) and less like the middle one (red cross). Now it is possible that the pullback we have seen continues (example: the red price arrow). My trade is predicated on a more likely outcome to be a continuation of the uptrend based on solid consumer numbers and continued cord cutting.
Income Trades
Two more income trades. On European banks, I continue to write covered calls on stocks that are unprofitable but I have extended the price move to 10%. My thought is grabbing back some income is helpful.
Société Générale SA (GLE.PA): French Bank. Sold March 2019 strike 27.5 calls for 0.48% premium (0.32% to purchase price). Closing price €24.98 (lower than last trade). Price needs to move another 10% to reach the sold strike (easier than last trade). Should price pass the sold strike I book a 26% capital loss. Income to date amounts to 1.5% of purchase cost.
Citigroup Inc (C): US Bank. Sold March 2019 strike 67.5 calls for 0.50% premium (0.48% to purchase price). Closing price $64.57 (lower than last trade). Price needs to move another 4.5% to reach the sold strike (easier than last trade). Should price pass the sold strike I book a 2% capital gain. Income to date amounts to 0.7% of purchase cost.
Cryptocurency
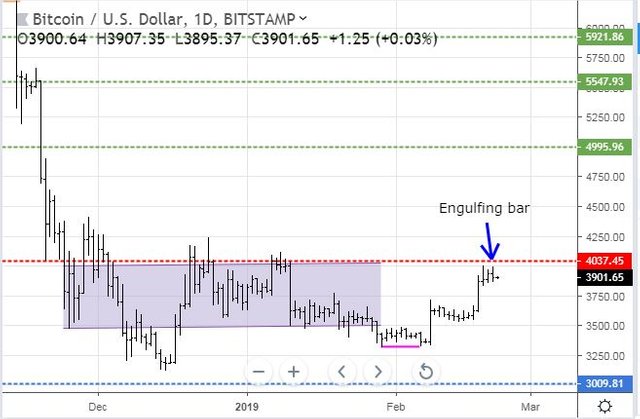
Bitcoin (BTCUSD): Price range for the day was $123 (3.1% of the high). A day of indecision was followed by a bolder move both up and down with price forming an engulfing bar with its high a lower high. This feels like the start of a pullback before having a go at clearing $4000.
Ethereum (ETHUSD): Price range for the day was $7 (5% of the high). Price action feels different here with price edging higher than the day before. This feels like a mini-consolidation before having a go higher.
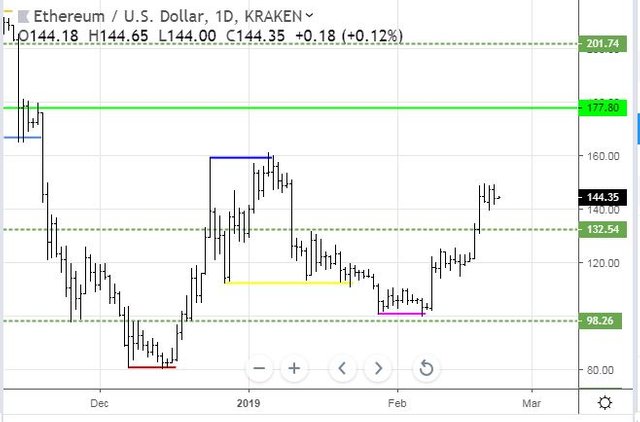
Beware: Postponed hard fork is slated for end February or early March
CryptoBots
Profit Trailer Bot No closed trades
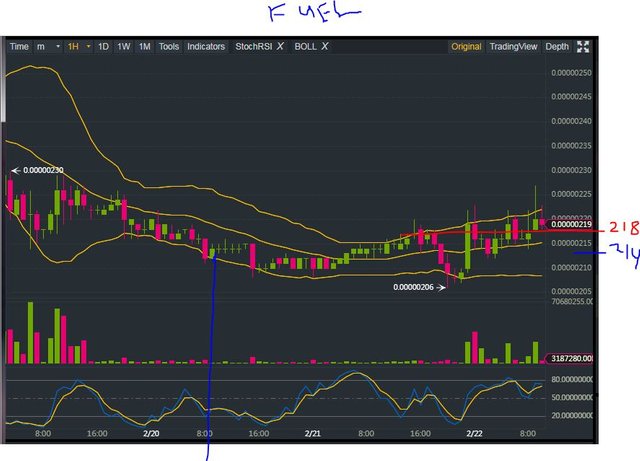
New Trading Bot Trading out using Crypto Prophecy. DCA trade on FUEL closed for 1.87% profit. Trade cycle shows trade right across the Bollinger Bands. Bot trading could have caught the next cycle.
Currency Trades
Outsourced MAM account Actions to Wealth closed out 9 trades for 1.3% losses for the day. Disappointing losses short AUDNZD given the horror session for AUD that unfolded after trade closing when news broke that one Chinese port had banned coal shipments from Australia. New trader is certainly more volatile than the last one. One trade open on USDCAD which is marginally profitable
Cautions: This is not financial advice. You need to consider your own financial position and take your own advice before you follow any of my ideas
Images: I own the rights to use and edit the Buy Sell image. News headlines come from Google Search. All other images are created using my various trading and charting platforms. They are all my own work
Tickers: I monitor my portfolios using Yahoo Finance. The ticker symbols used are Yahoo Finance tickers
Charts: http://mymark.mx/TradingView - this is a free charting package. I have a Pro subscription to get access to real time forex prices
Crypto Prophecy provides a useful tool to identify oversold and overbought coins - https://mymark.mx/CryptoProphecy
February 21, 2019
As the market begins to understand that uncertainty remains limited, sentiment will definitely improve.
Posted using Partiko iOS
Indeed. Already playing out with Fed uncertainty removed.