TIB: Today I Bought (and Sold) - An Investors Journal #264 - Mortgage Servicing, Strategic Metals, Swiss Franc
Currency markets tell the tariff story crisply. Other markets bounce. Time to tidy up a bankruptcy by buying more warrants. Looking for reversal in strategic metals. Tough lessons in long term currency trades.

Portfolio News
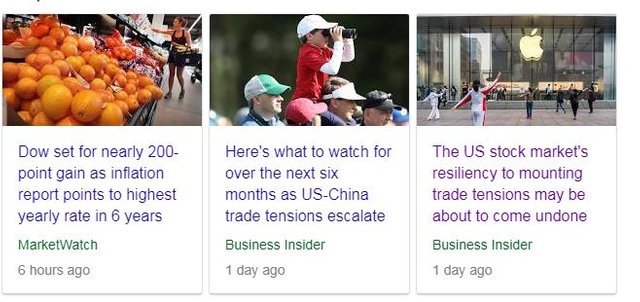
Market Jitters - Tariff Tantrum I watched US markets bounce back on the release of CPI data in US.
Basic sentiment seemed to be that a slightly softer inflation number would keep the Federal Reserve at bay. And Treasury Secretary, Steve Mnuchin was doing his best to describe the trade war as a trade dispute. Who is he trying to kid? All one has to do is listen to the Chinese Finance Minster to know the answer. The headlines give some clues as to how people are feeling. In one breath we see NASDAQ make a new high and we are being told about all the bad stuff that will be coming along.
The Insider article is based on some scenario modelling by UBS. It makes for scary reading depending on which scenario one believes will play out. The bad scenario suggests a 20% pullback in US markets is possible. The market is not thinking that way. If it did, the market would not have gone up.
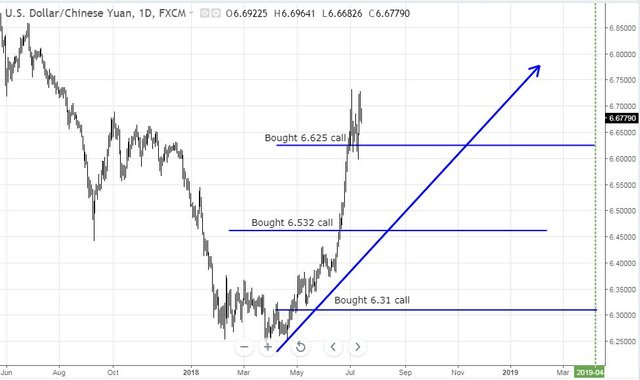
There are some key charts that maybe reflect the reality of the tariff tantrum more closely. First is the Chinese currency (CNH) against the US Dollar. This has had two goes now at breaching the 6.75 level. I am not convinced that it can hold below that level without intervention.
I have a big profit (130%) sitting in the 6.31 call option and cannot really decide whether to exit or not. There is quite some way to the top of the blue arrow scenario which is well before February 2019 expiry.
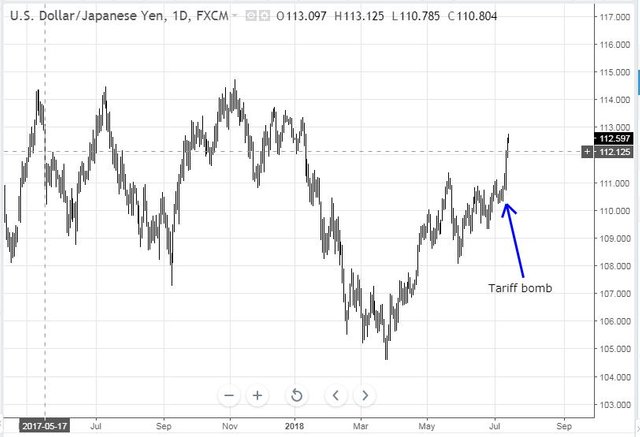
Second is the Japanese yen. Normally, Japan is the "go to" safe haven trade when markets get uncomfortable which sees the Yen climb. The chart shows that it has not done that since the tariff bomb was lobbed in on Monday. It has done quite the opposite.
The talking heads are somewhat baffled. Japan Government Bonds have not really spiked either. My read is there are two things that have changed. US treasuries at the short end of the yield curve are being used more as a safe haven. More importantly, while the tariff war is with China, I think Japan will not be excluded from the tariffs. I just have to see the fall in Osaka Titanium (5726.TK) to know that is true. The good news in my portfolios is I am holding a hedging position short the yen, to hedge my Japan stock holdings. It is back in the money doing what a hedge does = protect from a falling currency.
Bought
Ditech Holding Corp (DHCP): US Mortgage Servicing. Formerly known as Walter Investment Management Corp and restructured in February 2018 following a Chapter 11 administration to restructure company finances. Part of the restructuring was the issue of two sets of warrants
A warrants $20.63 February 9, 2028
B Warrants $28.25 February 9, 2028
These warrants were listed on NYSE on July 3 giving me the option to buy more or to sell my small holdings.
I was a shareholder of WAC and received small (unmarketable) parcels of each of these warrants. I purchased additional warrants to convert my holdings into marketable parcels. My plan will be to sell the warrants when price begins to move on the underlying stock. I doubt I will ever recover my investment in the whole WAC saga.
With a closing price of $5.56, I will be very surprised if these warrants ever get to respective strike prices. That said, I have had good success in investing in these sorts of long dated warrants in the past - time will tell and 10 years is a long time in markets. I do notice on the investor relations site for the company that they have appointed advisers to complete a strategic review including the potential sale of the business.
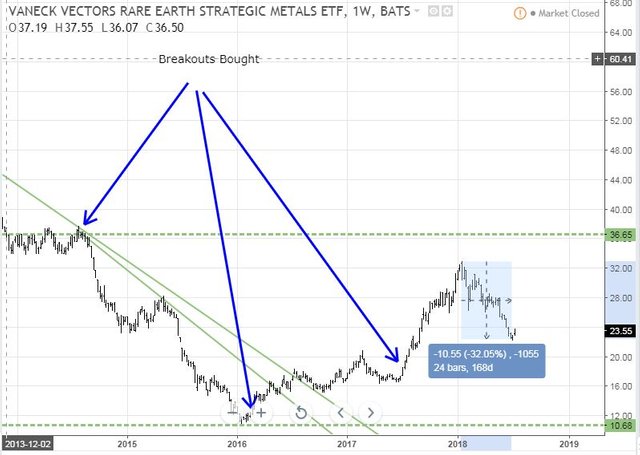
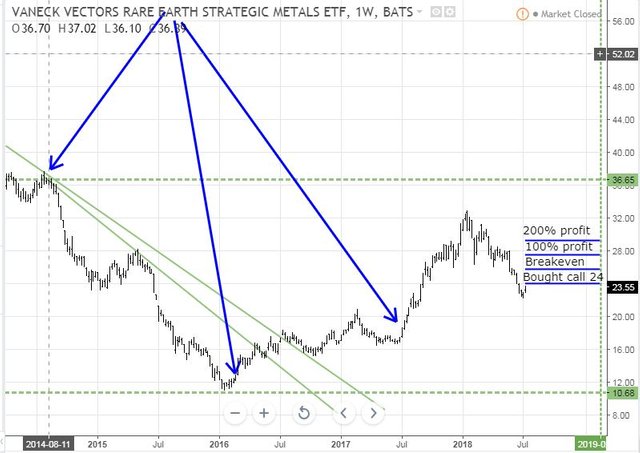
VanEck Vectors Rare Earth/Strat Mtls ETF (REMX): Rare Earths/Strategic Metals. Metals prices have taken a big back step since the tariff tantrum started in January. This ETF which invests in a range of metals and rare earths has not escaped the damage with a 32% drop since the January 2018 highs. I have bought into the ETF a few times based on breaks up - the updated chart shows the story. Overall I have one trade that is underwater and two that are profitable.
Two things caught my eye which got me reviewing trade ideas again. China was threatening retaliatory tariff action on rare earths. This is an important topic as they are the largest producer globally of many rare earths. A portion of the holdings in the ETF are in rare earths mostly based outside of China. They have to benefit from China tariffs. The rest of the ETF is invested in materials that are the heart of electric vehicles (lithium and cobalt) and a lot in aerospace (titanium and tungsten). Also the chart has been showing signs of a reversal from the sell off.
I had a look at options chains and bought February 2019 strike 24 call options. That was as far in time as I could get and the strike is a little above the $23.55 closing price. Let's look at a chart which shows the bought call (24), breakeven, 100% and 200% profit as blue rays with the expiry date the dotted green line on the right margin.
First thing to note is price has made a reversal on a weekly chart. Next thing to note is 200% profit level is well below the recent highs. Lastly, any one of the small runs up we saw in 2015 or 2016 will take price comfortably past 100%. A repeat of the run to the late 2017 highs will push the trade close to 500%. Markets are going to be uncomfortable while the US tariffs consultations progress - February 2019 expiry could be too close.
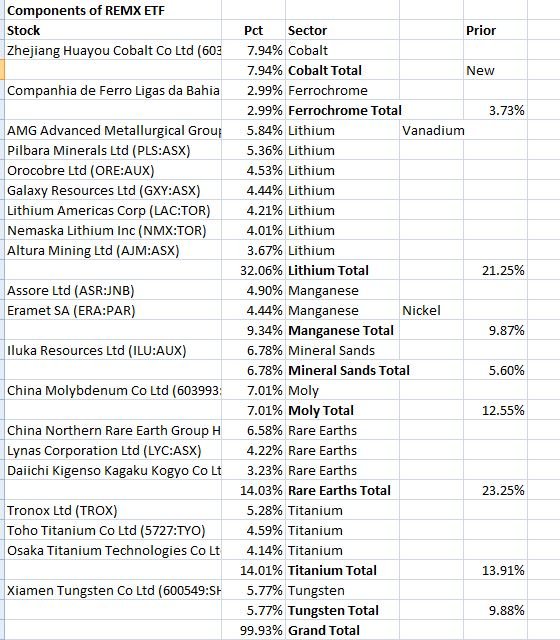
The mix of holdings in the ETF has changed since I last wrote about it in TIB121 (August 2017). There is more Lithium, a new entrant in cobalt and a lot less rare earths. I am already strongly exposed in Lithium. Maybe a better way to go is to invest in a few of these specific holdings. A new entrant that I was impressed with in the detail is Advanced Metallurgical Group (AMG.AS) which is a Dutch business invested in what they call critical materials, with something of a focus on aerospace and lithium.
Cryptocurency
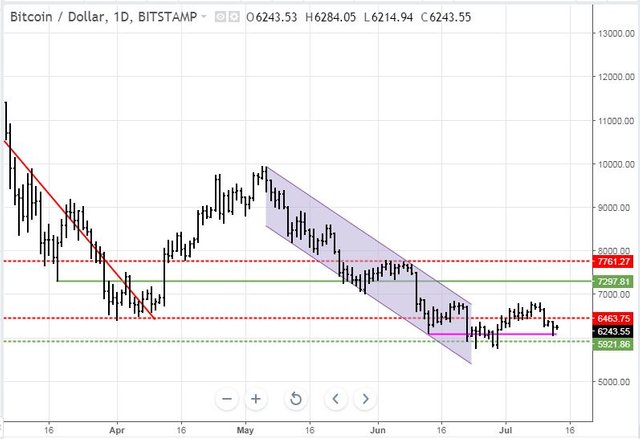
Bitcoin (BTCUSD): Price range for the day was $308 (4.8% of the high). After dipping earlier in the day, price pulled back from the lows and closed just above half way making for something of a low test bar testing a level from a month ago (the pink ray). It will be encouraging if we can see price pass yesterday's high and close above. But it is Friday - I have my doubts (though I was wrong last Friday)
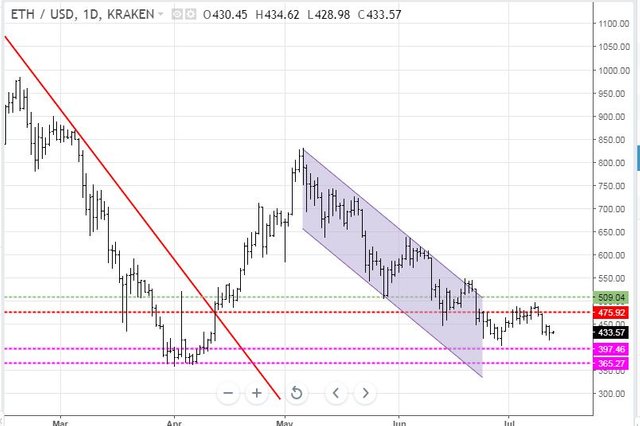
Ethereum (ETHUSD): Price range for the day was $29 (6.5% of the high). After diverging from what Bitcoin did earlier in the day, ETH price did much the same as Bitcoin. Pushed lower and recovered to end up about half way in the day's range. We would need to see price pass the highs from the last two days to see any upward momentum.
CryptoBots
Outsourced Bot No closed trades. (213 closed trades). Problem children was unchanged (>10% down) - (18 coins) - ETH, ZEC (-53%), DASH (-53%), LTC, BTS, ICX (-54%), ADA (-48%), PPT (-61%), DGD (-54%), GAS (-66%), SNT, STRAT (-57%), NEO (-61%), ETC, QTUM (-53%), BTG (-62%), XMR, OMG.
NEO and GAS improved a little but stil remain over 60% down.
Profit Trailer Bot Two closed trades (1.65% profit) bringing the position on the account to 0.41% profit (was 0.38%) (not accounting for open trades).
There are no coins on the Dollar Cost Average (DCA) list with NANO moving off and onto profit after one level of DCA.
Pending list remains at 12 coins with 8 coins improving, 2 coins trading flat and 2 worse. This is a long wait but at least there are now some wins coming along on the whitelisted coins.
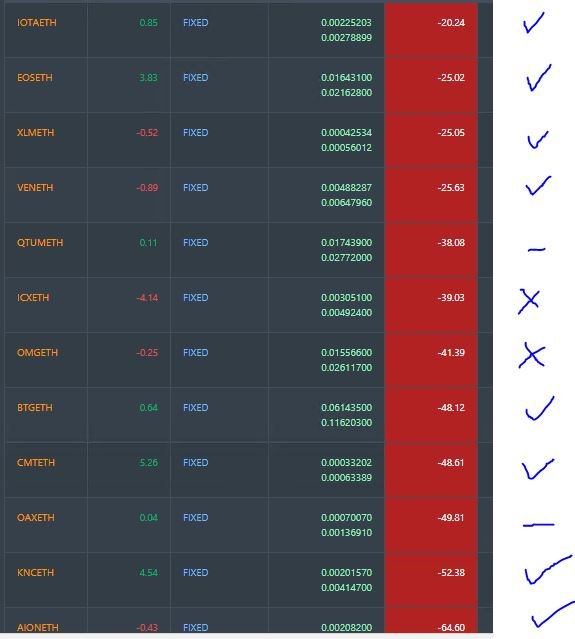
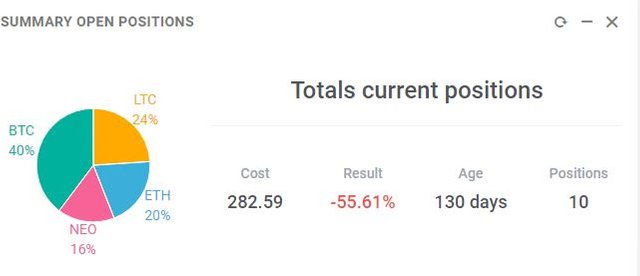
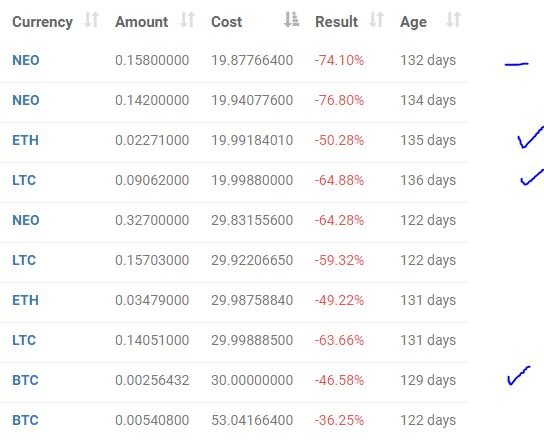
New Trading Bot Positions improved 1 point to -55.6% (was -56.4%)
NEO traded flat and the other 3 coins all improved a little.
Currency Trades
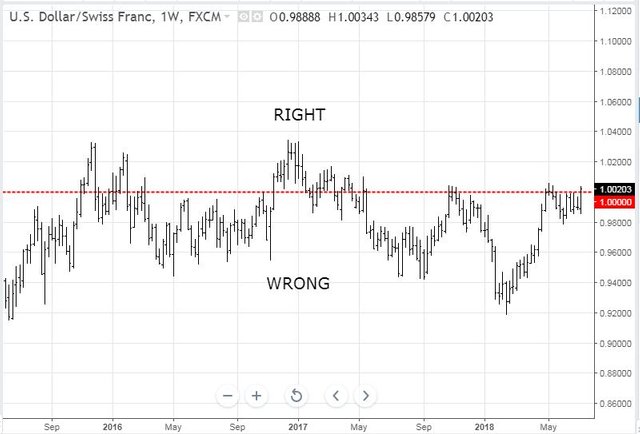
Swiss Franc (USDCHF): Yesterday saw the expiry date for a long dated option long on USDCHF in my IG Markets account. The original positions were set up two years ago and I have added to the position a few times since. The strike price was a tidy 1.000 and the trade idea was for US Dollar to strengthen as rates rose in the US. For quite some months the trade was working well with USD climbing from 0.9200 at the start and clearing 1.0000 by late 2015.
The chart tells a story about being right and wrong.
Good news is the trade idea was broadly right - because price closed 20 pips above 1.000 at expiry and it did spend some time above 1.000 along the way. And I did add to the trade quite a few times when price made reversals in the WRONG zone. There are some strong lessons in the trade. Two years is a long time in currency markets. Because Switzerland is viewed as a safe haven, the Swiss Franc is not the best way to run a US Dollar strength trade. Euro might have been better. There were opportunities to exit the trade along the way. The biggest lesson is about understanding the way the trade is set up. I thought this was an options trade in which one pays the premium in advance and takes delivery at expiry if the option finishes in the money at the strike price. Wrong, this trade was executed at IG Markets as a CFD. That means it is cash settled at the end and the net premium is paid then. I did get 20 basis points credited off the premium.
Lesson learned and this is the last IG Markets options trade on the books.
Forex Robot did not close any trades and is trading at a negative equity level of 3.2% (lower than prior day's 3.3%).
Outsourced MAM account Actions to Wealth closed out 2 trades for 0.38% profits for the day.
Cautions: This is not financial advice. You need to consider your own financial position and take your own advice before you follow any of my ideas
Images: I own the rights to use and edit the Buy Sell image. News headlines come from Google Search. All other images are created using my various trading and charting platforms. They are all my own work
Tickers: I monitor my portfolios using Yahoo Finance. The ticker symbols used are Yahoo Finance tickers
Charts: http://mymark.mx/TradingView - this is a free charting package. I have a Pro subscription to get access to real time forex prices
Crypto Trading: get 6 months free trades with Bitmex for leveraged crypto trading. http://mymark.mx/Bitmex
Bitcoin: Get started with mining Bitcoin for as little as $25 http://mymark.mx/Galaxy
July 12, 2018

Hey Nice post! I have invited you to become part of Minnowbooster Whitelist!
Enjoy the opportunity, cheers!
Step 1. Delegated some SP.
I think try to calculate well in the next few months, if in the near future the currency market rose may be collected as much as possible. but if not please be patient first, success always for you @carrinm.
You are a good investor @carrimn, my support is always with you.