$ICN/BTC Technical Analysis Dec. 27, 2016.
Hello Steemers!

As requested by @ozzy-vega, I did an update on the ICONOMI chart.
Starting of with the charts I did on 4, December and bellow them today's chart of the same time frame.
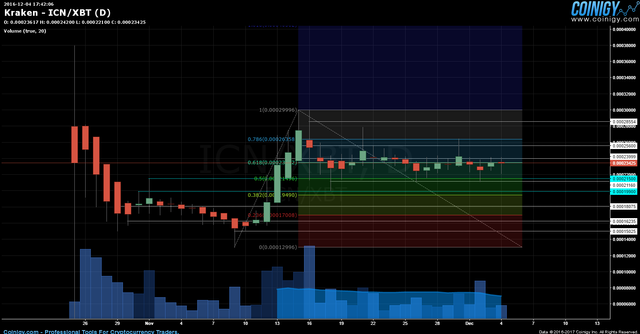
daily chart Kraken-fib - Dec. 4, 2016
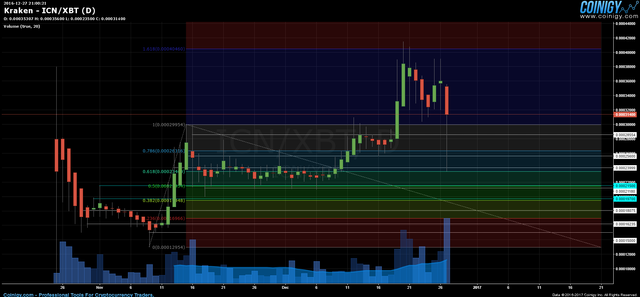
daily chart Kraken-fib - Dec. 27, 2016
We can see how the price broke upwards from the accumulation are, first breaking the 0.00024 line firmly, then also the 0.00026 levels without any problems. After that came a slight flat out at all time high levels where the price traded between the 0.000285 and the 0.000256 line.
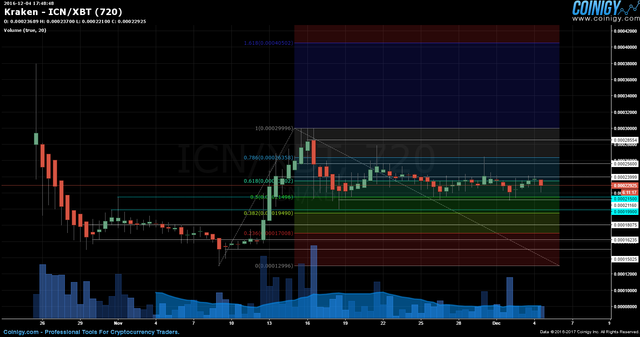
12 hour chart Kraken-fib - Dec. 4, 2016
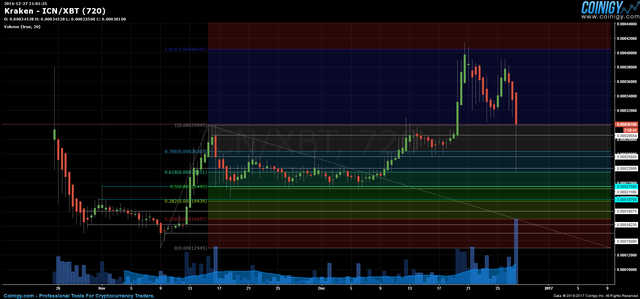
12 hour chart Kraken-fib - Dec. 27, 2016
After just a few days it broke the resistance of the all time high and went for a new all time high at the next fib level marked around 0.0004 BTC, with a top at 0.000414 BTC.
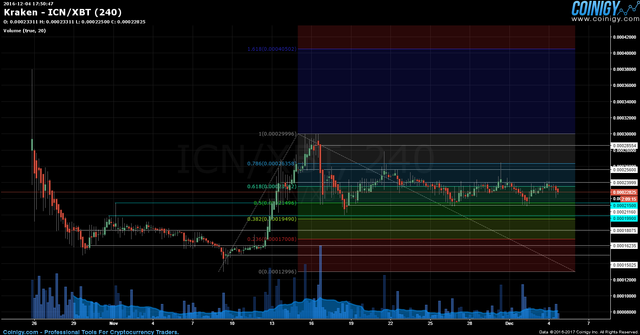
4 hour chart Kraken-fib - Dec. 4, 2016
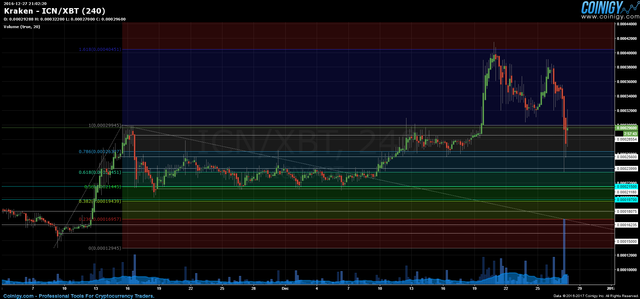
4 hour chart Kraken-fib - Dec. 27, 2016
After the making of the new all time high came a pullback to the levels of the previous all time high ~0.0003, and then another small rise to about 0.00038 BTC around Xmas, after which the price started falling drastically and has made a new local low at around the top of the previous accumulation level, touching the fib line at 0.000235 just a bit bellow the 0.00024 line.
After the hard dump the price got pulled back and is now trading at around 0.00029 BTC.
New charts.
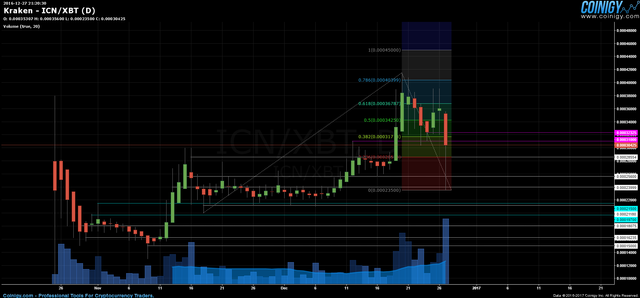
daily chart Kraken-new - Dec. 27, 2016
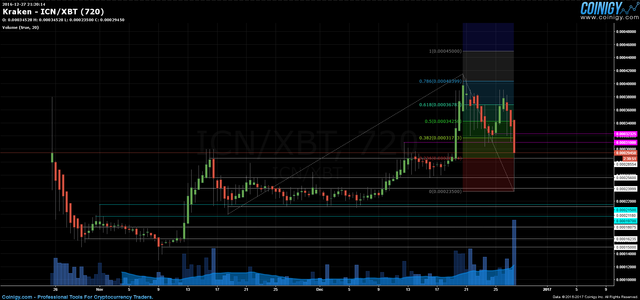
12 hour chart Kraken-new - Dec. 27, 2016
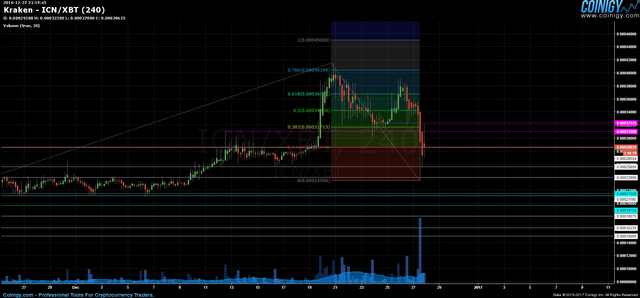
4 hour chart Kraken-fib - Dec. 27, 2016
I added a new fib and 2 new lines, the purples ones, the 31k one and the 32.3k one.
During the pullback from the dump the price touched the 32.3k lines and got dumped back to about 28.5k where it's traded now. and seems to be forming a new accumulation zone.
COMMENT
Once again, I will post the comment by commenting as it involves my personal opinion!
Thank you for understanding!
If anyone has any questions or need's help fell free to ask, I will try to explain as fast and as best as I can.
Critics, comments, reply's, counters, advice's, etc. are always welcome!
Have my charts helped you in any way?Let me know with a comment below :)
Are there more people who are doing TA?
Please post the links to your TA's posts into the comments as well!
DISCLAIMER
I am showing multiple scenarios on the price movement, in the post itself I do not take any stance, either bullish or bearish. I am not responsible for neither you’re winning nor you're losses upon trading! the "comment" section is my personal opinion and does not mean I have to or do hold any positions in the given market.
Everyone who uses TA develops his own unique charting style, please keep that in mind.
Kind regards, OZ :)
COMMENT
Expecting the price to form a new major accumulation zone between the today's
made local low and the 31k line, with the upper half between the 28.5k line
and the 31k line and the lower half bellow it.
im awaiting ICN to be added to Polo or Bittrex, i dont like Kraken