You are viewing a single comment's thread from:
RE: Bitcoin: How to Read Those Bloody Charts? And My Short Term Prediction.
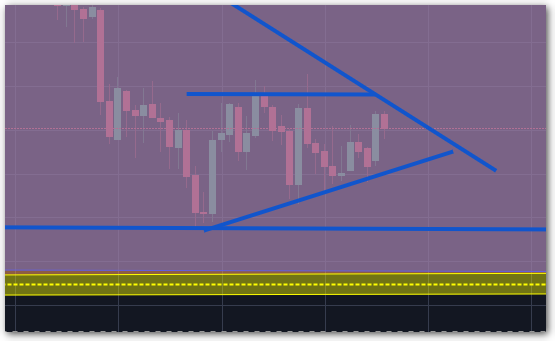
Yeah, the 1-Hour chart looks pretty downish and sideways...and had that slight uptick I was kinda expecting.
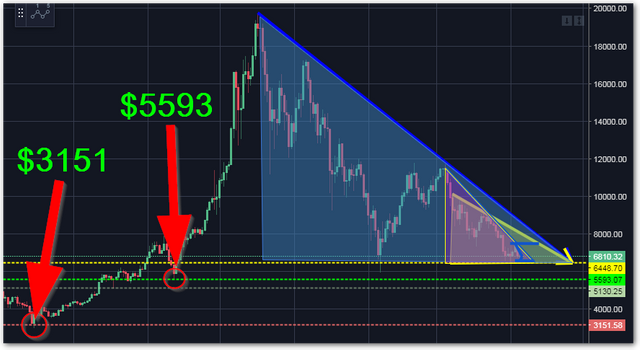
I'm keeping an eye because if it really breaks those support lines...the next fall could be around $5593 and then $3151.