ICO&Long term cryptocurrency investment organizer with chart and formulas in Excel
Hello steemians and cryptomaniacs! Today I'm going to share with you my chart for tracking the performance of an ICO investment or a long term buy cryptocurrency.
The need for such a chart appears when you start to buy many long term coins or when you invest in couple of ICOs and you want to regularly see your progress. Personally I enjoy tracking some of my assets especially when they rocket as is InsureX doing now and if you're using formulas you can easily update your progress in the chart with only a copy/paste of the actual price.
In the example below I used the formula for the first row of the excel. For using the same formula for other cells you can drag the formula to the cell below it, or copy/paste it, or modify manually from K2 to K3 and so on, for each row.
So let's break the table below:
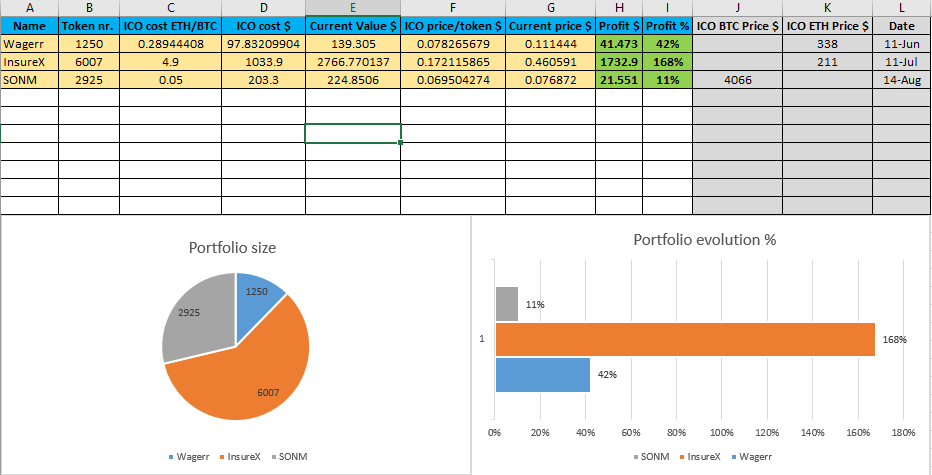
Name: coin name - manually
Token nr.: number of tokens acquired - manually
ICO cost ETH/BTC: the total value of the buy transaction in ETH or BTC - manually
ICO cost $: total value of the buy transaction in USD - formula: =C2K2 or =C2J2 depending if it's BTC or ETH column
Current Value $: current total value of your tokens - formula: B2*G2 meaning total nr. of tokens multiplied by actual value per token
ICO price/token $: the value in USD per token which had in ICO - formula: D2/B2 meaning total ICO transaction value divided by total nr. of tokens received
Current price $: current price in USD per token - manually - you can take it from an exchange or from https://coinmarketcap.com/
Profit $: the profit in USD. Attention! This is only the profit, not the total amount invested - formula: =(G2-F2)*B2 meaning actual price per token minus initial price per token multiplied with the total number of tokens
Profit %: same like profit in $ but in percentage and calculated with difference between total amounts - valued initially and current - formula: =(E2/D2)-1
ICO BTC Price $ & ICO ETH Price $: for the rest of formulas to work you need to complete this cell with the value of Bitcoin or ETH (depending on which coin you contributed to ICO) which had in the day you contributed to the ICO. This value you can take from Historical data tab from coinmarketcap for each of the coins. Example of BTC: https://coinmarketcap.com/currencies/bitcoin/historical-data/
Date: the date in which you contributed to ICO which is optional
For the charts I have chosen:
Portfolio Size chart - the cells with coin names and the cells with total number of tokens
Portfolio evolution % chart - the cells with coin names and the cells with profit in percentage
Of course there are more optional things to put in the table to expand it depending on each needs but this is a basic tool which you can use to easily see your long term coins progress.
I hope you all enjoyed it and I hope it will be useful for you too! Like and share!
Cheers!