Bullish Analysis for BTC/USD
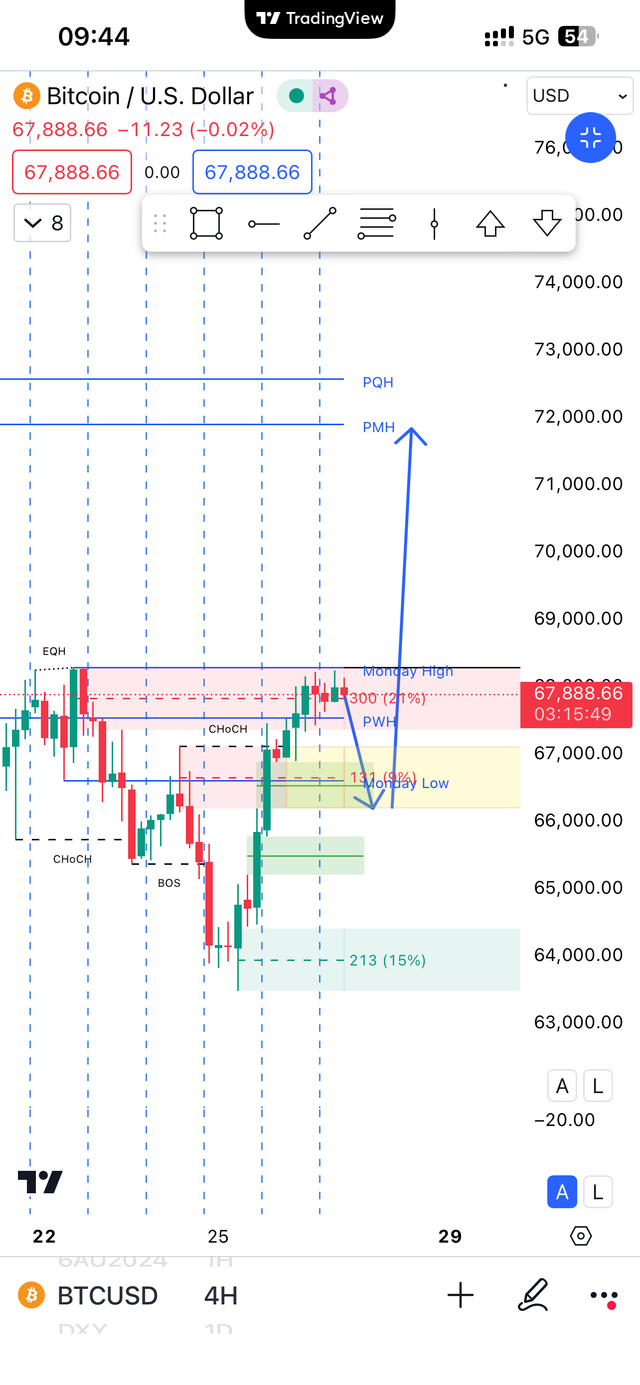
The BTC/USD chart indicates a bullish sentiment. Currently, Bitcoin is trading at around $67,888.66, showing minor fluctuations. Key indicators support a potential upward movement:
Change of Character (CHoCH) suggests a shift in market sentiment from bearish to bullish.
Key Levels
- Monday High: $68,300, acting as a resistance level.
- Monday Low: $66,800, now turned into a support level.
- PWH (Previous Week High): $68,100, another critical resistance.
Potential Targets:
- Short-term: If the price holds above $65000, the next target would be the Previous Quarterly High (PQH) around $72,000.
- Long-term: Sustained bullish momentum could drive the price towards $76,000.
Volume and Momentum:
The recent bullish candles with increasing volume indicate strong buying interest.
Support Levels:
- Immediate support at Monday Low ($66,800).
- Stronger support zone around $65,000, where significant buying interest is expected.
This bullish outlook is contingent on maintaining support levels and breaking through immediate resistance. A break above $68,300 would confirm continued bullish momentum.