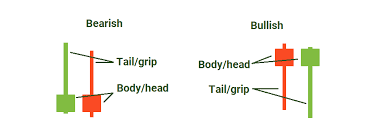
Candles patterns that identify Trend Reversal. (Bullish and Bearish Pin Bar)
The pin bar is one of the price action strategies used to trade trend reversal or continuation depending on where it is located. Today in this course, I will be discussing in-depth how to trade the pin bar.
As a price action trader, I have come to understand the power of the pin bar in a chart. Whenever you see a pin bar in a daily or 4 hours timeframe chart, most especially when the pin bar is in the direction of the trend, please just enter the market at that point and long or short the market depending on the direction of the trend.
It is important to mention here that it is not all pin bars that are worthy to be traded and that is the reason I said you should consider using a higher timeframe to determine the real pin bars. Pin bars are traded alongside some other confluence factors or indicators such as the 21-MA, support and resistance level, trend of the market, Fibonacci retracement etc.
Before trading any Pin bar, ensure that at least one or two of the aforementioned factors is in play. When you have them, and the pin bar is seen at the support or resistance level then place your trade in the direction of the trend.
The pin bar is made up of a real body and a wick. For the bullish pin bar, you have a real body with a long lower wick which must be at least twice the length of the body. That is the main design structure of the bullish pin bar.
It is important to mention here that the colour doesn't matter I.e it can be red or green but a pin bar with a green body is more effective than a pin bar with a red body when the trend is bullish or during an uptrend movement.
For the bearish pin bar, you have a real body with a long upper wick which must be at least twice the length of the body. That is the main design structure of the bearish pin bar.
It is important to mention here that the colour doesn't matter I.e it can be red or green but a pin bar with a red body is more effective than a pin bar with a green body when the trend is bearish or during a downtrend movement.
When these pin bars are seen in major support and resistance points or demand and supply area, it implies that the current trend is getting to an end and a new trend is about to take over. It is also used as a trend continuation when seen in a trending market.
Every price action trader loves trading pin bars because when it is combined with the confluence factors such as the support and resistance, 21-MA, the market trend and the Fibonacci retracement, it gives you a valid signal which will help you make a lot of money in the market. I'm a new trader but this has proven very effective for me and I will continue applying it.
.png)
Thank you, friend!


I'm @steem.history, who is steem witness.
Thank you for witnessvoting for me.
please click it!
(Go to https://steemit.com/~witnesses and type fbslo at the bottom of the page)
The weight is reduced because of the lack of Voting Power. If you vote for me as a witness, you can get my little vote.
Congratulations, your post has been upvoted by @scilwa, which is a curating account for @R2cornell's Discord Community. We can also be found on our hive community & peakd as well as on my Discord Server
Felicitaciones, su publication ha sido votado por @scilwa. También puedo ser encontrado en nuestra comunidad de colmena y Peakd así como en mi servidor de discordia
Upvoted! Thank you for supporting witness @jswit.
Thank you for sharing this post on trend reversals, thanks for sharing with us 😊
You're really improving in your crytpo technical analysis, do you by any chance trades futures?
Candles patterns that identify Trend Reversal is so awesome post.