My technical analysis of the ARBUSDT charts
The Arbitrum token (ARB) is mostly used for governance in the Arbitrum DAO. ARB holders are able to take part in decentralized governance decisions which are executed on-chain automatically.
Arbitrum is a layer 2 that is built on the Ethereum blockchain. It is easily usable and accessible to those who are conversant with making transactions on Ethereum and are familiar with decentralized platforms like uniswap and sushiswap.
Let us take a look at the ARB charts and analyze them.
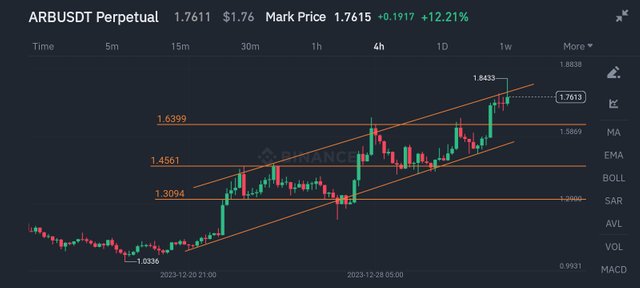
The Arbitrum 4-hour chart is a straightforward one. It has some twists. The price has been in an uptrend but along the way, there were some consolidation periods.
Just like most uptrends, there are usually higher lows and higher highs. To confirm the uptrend, I drew a trend line connecting the lower lows and I also drew a trend line connecting the higher highs.
After an initially long period of consolidation, the uptrend began. The price rose until it got to the range of $1.3 to $1.45. It consolidated at this point. It just kept on moving sideways for a long while.
Eventually, the price moved up until it got to a resistance level around $1.63. From this resistance level, it went down to find support at the familiar $1.45 price.
From this support level, it made its way back up, facing resistance at $1.63 but still continuing the uptrend.
I believe that the uptrend will continue in correspondence with the current bull run in the crypto market. It will keep having higher highs and higher lows until it reaches a major resistance level, forcing sellers to push the price back down.
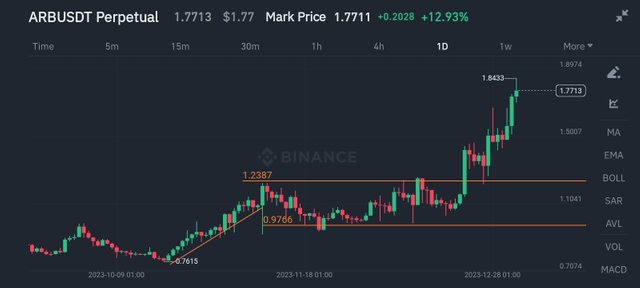
As usual, the 1-day time frame provides us with a broader view of what is happening in the Arbitrum charts. From this time frame, the market went sideways initially. Then the price made its way up. It got up to the $1.23 range and started moving horizontally.
While moving horizontally, the price kept fluctuating between $1.23 and $0.97 until, eventually, there was a break-out, and price pumped massively. This breakout is a good buying opportunity for most traders as there is every tendency that it will continue in a bullish run.
Note: This article is not a financial advice
https://twitter.com/Oguzvic1/status/1742186431584383189?s=19
Amazing Analyses, very important points, thank you for that!
Great analysis on ARBUSDT, love the broader perspective you provided on the daily timeframe