My technical analysis of AVAXUSDT charts
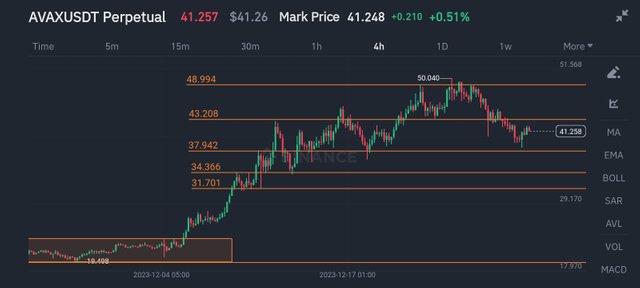
The AVAX chart is quite an interesting one. In the 4-hour time frame, there has been an uptrend for a while. The price of AVAX has been on a steady rise. However, from the charts, you can see multiple levels of support and resistance.
From the 4-hour chart, there was initially a period of consolidation at the bottom of the chart. The price was just moving horizontally without moving upwards or downwards. You can see that I drew a rectangle to highlight this area of consolidation. Then eventually, the price took off in the upward direction and started an uptrend. This shows that buyers went into the market with a strong force to push price up.
The price got to around $34.366 and met strong resistance as it was pushed back down. That price is obviously a significant level in the charts because it later served as support level twice on the chart. As the price got resisted at $34.366, it hit $31.7 which served as support, and then it jumped back up until it got resisted again at $37.9. This resistance level of $31.7 is also a crucial level because it went on to become a support level multiple times later on in the chart.
The price got resisted again at $43.2, and then made its way back down until it hit support at $34.366 which was formerly a resistance level.
The level of $43.2 is also a significant level because it served as resistance and also support. The price went further up to $48.9 and was resisted until it got to support at $43.2 before bouncing back up to $48.9 again where it was resisted strongly. The price went downwards until it hit a familiar support level of $37.9, before bouncing back up, making its way in the upward direction.
One important thing to take away is that the prices of $31.7, $34.366, $37.9, $43.2, and $48.9 are all significant levels in the AVAX chart.
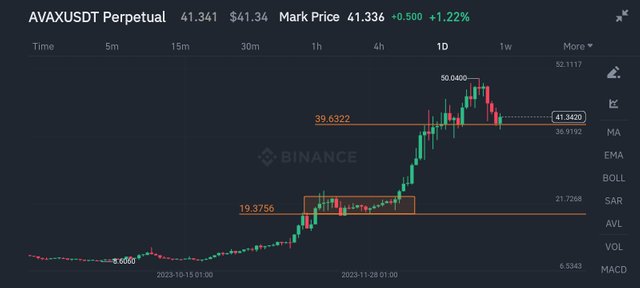
From the 1-day chart, you can see that the price moved in an upward direction until it started consolidating around $19.37. I indicated this consolidation area with a rectangle. After consolidating, there was a massive pump and the price continued on the uptrend until it got resisted at $50.04.
That's my analysis. Thanks for reading.
Note: This article should not be taken as financial advice
BullMarket these coins will not perform well, but BullMarket has some new coins coming! Those coins will perform well!
Nice explained brother. In the bull run it will pump.
Good TA from you, and appreciate the detailed explanation you provided on the support and resistance level as you were going about it demonstrated great price analysis ability
AVAXUSDT is a great analysis you have shared.
https://twitter.com/Oguzvic1/status/1741150670508507280?s=19