TRENDLINES AND HOW TO AVOID FAKE SIGNALS USING MOVING AVERAGES
Greetings,
It's your friend @mondraye and today I would be sharing another important content on cryptocurrency trading.
Cryptocurrency trading has been grown to become an income option to a lot of individuals with some making it a means of earning passive income while to some, it is a major career.
Irrespective of the group we belong, it is important we learn properly how to analyze charts in other to increase our chances of success in the volatile cryptocurrency market.
Today we will be talking about trendlines and how to avoid false entry signals on trendlines using Moving averages
Trendline as we know is simply a vertical line that marks the support and resistance areas of a trending market.
Drawing trendline appears to be very easy and as such most tutorials tend to pay less attention to it while most students assume they already know it and thus bother not to ask questions.
On a candlestick chart, a trendline can be drawn starting from the wick of the candle or the body of the candle and connecting at least 2 lows or highs of the trend.
- Example
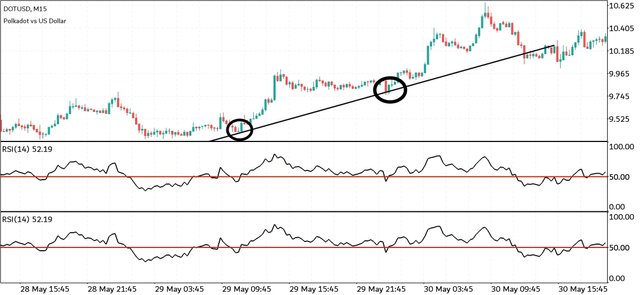
Trendlines are important not just because they help us in clearly seeing the direction of the trend but because they serve to provide entry signals using breakout strategy.
This is where moving averages comes in as it plays a major part in providing confluence on a trendline strategy.
- Moving averages
Moving averages are trendbased indicators that allows traders a clear view of market direction by trending above or below thd price chart. It indicates an uptrend movement when it trends below the price chart and a downtrend movement when it trends above the price chart.
The moving averages also serve to provide dynamic support and resistance on a price chart this further helps traders to know when a trend is possibly going to reverse.
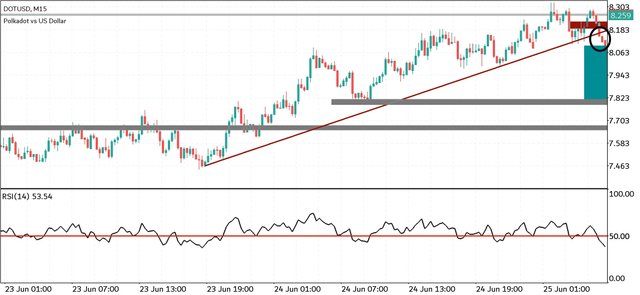
From the above, we will see that the price broke below the trendline and even went further to close below the trendline. This on a normal would make a trader who is solely based on using trendlines to take a sell position.
So I have assumed to have taken a sell position with my stop-loss properly set just above the breakout candle and my target set a more prominent support.
From the above, we will see that the price didn't continue on the downside despite breaking the trendline. Instead it reversed and smashed our stop-loss.
In other to avoid falling for such fake reversal, we will have to add a moving average indicator which will be serving as a dynamic support for us.
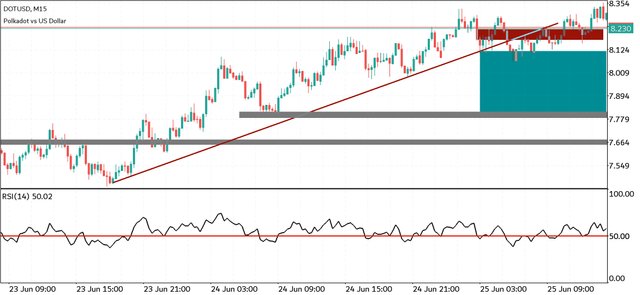
I will be adding a 100 period- simple moving average indicator on the price chart I'm other to clearly see what the price is going on with the price.
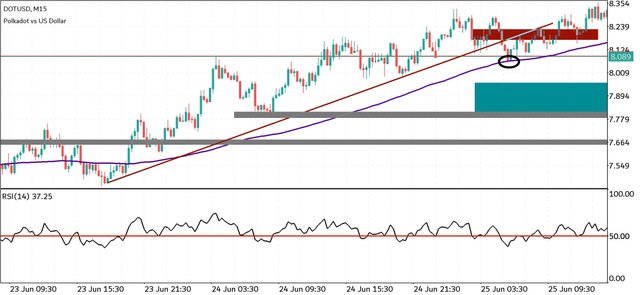
From the above, we will see that the price did not break the moving average indicator but only bounced off it before continuing on an uptrend.
In other to properly take an entry using the trendline break strategy, it is best to find confluence using the moving average. This means that we will have to wait for the price to break not just the trendline but also the dynamic support which is provided by the moving average.
When this happens, we can be more sure of a possible price pullback or trend reversal.
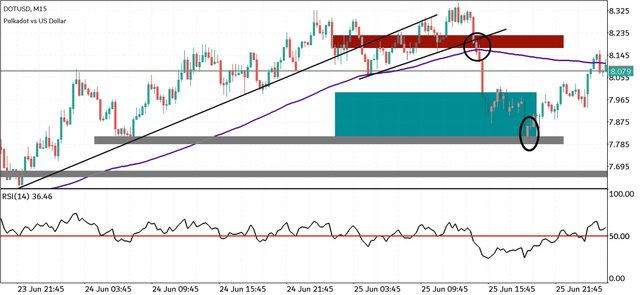
From the above we will see that the price broke the new trendline and went further to breaking and closing below the moving average.
Also, you will see that the stop-loss is properly set just above the breakout candle and the take profit maintained at the expected position.
Summary,
The trendline break strategy is a very popular strategy amongst traders due to its more frequent occurance.
In as much as this strategy is common, it is always best to combine it with other technical analysis tools in other to find confluence which will help in increasing the probability of success in our trade.
10% to @Tron-Fan-Club
Tweet link
https://twitter.com/SonOfMaaan/status/1541110555196510210?s=19
It is good to watch out for the fake trendline break and knowing how to set the right setting will help alot. Thanks for the interesting content.
You're right.
I hope the content was useful?
Thank you for appreciating my effort. I deeply appreciate
You're doing well dear friend. Your post has been one of those that have been catching my attention lately. Keep putting effort. #steem-on
Thank you brother for your encouraging comment. It is well appreciated
Hello dearest friend
Thank you very much for giving such an informative post.
I enjoyed going through your post and I hope to read more of your interesting post.
#steem-on 💙
Thank you for this lecture man. As a crypto newbie I say these charts and looked at them with confusion and ignorance but by following your lectures, the knowledge is starting to be a part of me and very soon I will go into in-depth analysis
I'm glad to here that.
I will keep dropping contents with the aim of educating us on cryptocurrency trading.
Watch out for my next post.
TrendLines are doing a significant contribution to the technical analysis field. You have really collaborated it with your own words. Thank you very much for this valuable article.
Thank you for appreciating my content. I really appreciate you
You are most welcome my friend. Keep doing such great articles here. Good luck.
Wonderful article you've made here, I enjoyed reading