TRADING THE CRYPTO MARKET USING SUPPORT AND RESISTANCE LEVEL 1||10% to tronfanclub
Today we would be talking about the most fundamental tool in every trader toolbox which is the support and resistance and I want you all to think of it as a cheat code in helping you anticipate the next direction of price making you more confident on that next trade
Trust me whether you are new to the game of trading or a seasoned trader, this content will give in details how you can step up using support and resistance
If you are excited, please sit tight ,grab a cup of coffee as we explore the world of trading using these levels.
When technical analysis came to full limelight, in the 19's, support and resistance where the foremost concept in trading, and why it was given the name was because it represent a point in price where the possibility of either a reaction or reversal is likely to happen.
In order for us to make the right trading decision,it is very important for us understand these concept in-depthly . And for this purpose I would be taking these concept one after the other for easier understanding..
FOR THIS LESSON I WILL BASE ALL MY CHART USING TRON
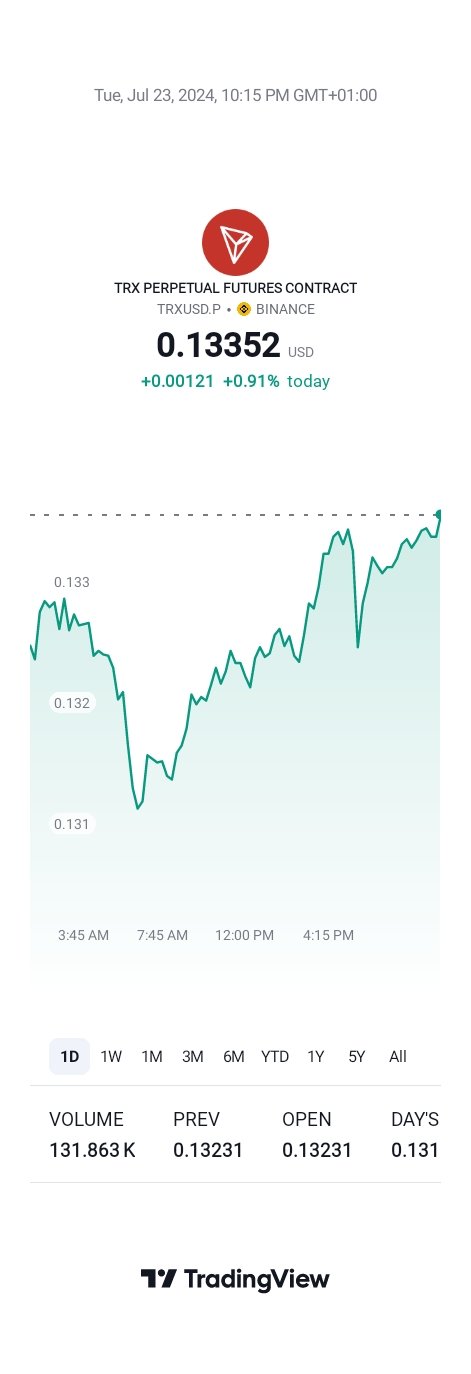
This screenshot was taken on my fone
A support level is a zone in price point where a downtrend pauses due to increasing demand of the commodity(TRON) at that level.
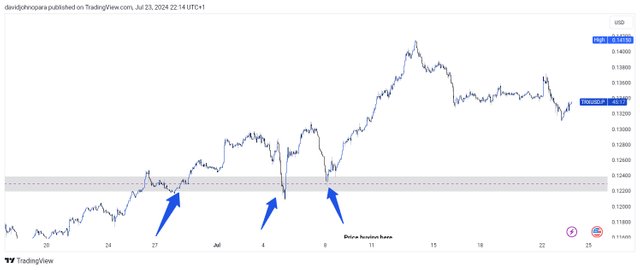
This screenshot was taken on my fone
What this simply means is that it is a zone level where sellers do not see anymore reasons to continue push price lower, also making price attractive enough for buyers to come into the market and push price up..thus preventing the market from falling any more lower
Sometimes when price continually test a level multiple times, price eventually breaks through it and that level becomes a new resistance, this is what we call support turned resistance
A Resistance is a zone in price point where an uptrend pauses due to increasing supply of the commodity(TRON) at that level.
What this simply means is that it is a zone level where buyers do not see price attractive enough to continue to push price higher also making price high enough for sellers to come into the market and push price up..thus preventing the market from going any higher it is the direct opposite of support
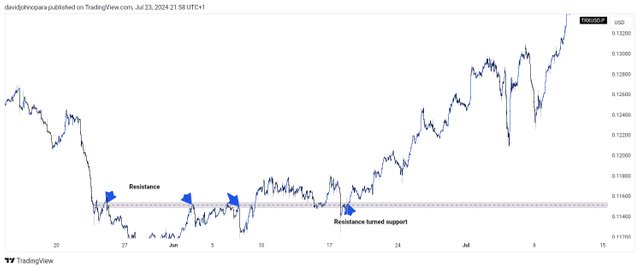
This screenshot was taken on my fone
Sometimes when price continually test a Resistance levelmultiple times, price eventually breaks through it and that level becomes a new support this is what we call resistance turned support
Here I will teach the methods I use in identifying support and resistance levels effectively
ZONE METHOD
Price doesn't tend to bounce of on just a price level alone but it bounces off several price levels we call a zone studying previous price movement could help us identity where price would likely consolidate and show tendency to reverse
It often help us know the level that is a strong resistance or support
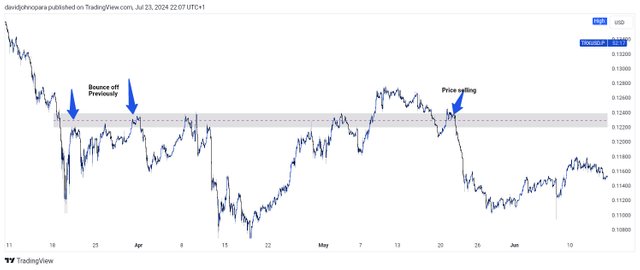
Resistance example
TRENDLINE or METHOD
Trendlines are drawn on the chart to indicate a possibility of price either going up or coming down
It is done by either connecting two or three lows together or highs
The low signifys support area and the third bounce on the trendline is where you are expected to buy from
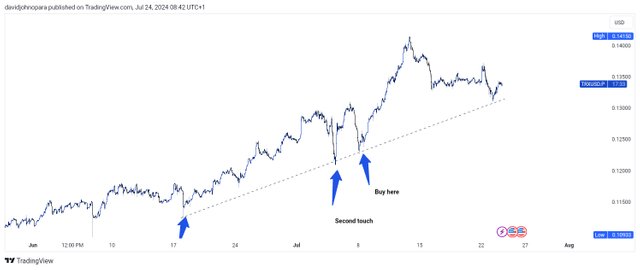
While the highs signify the resistance area and the third touch of the trendline signify where u should sell from
When a TRENDLINE has been tested on the lows multiple times it breaks and precise then comes back to retest the trendline we call that trendline break
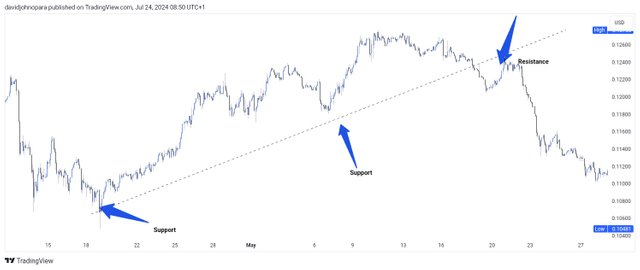
Trendline break
Haven learnt what support and resistance is I want us to go practice how to spot these opportunities yourselves so when next I talk on my personal trading strategy using support and resistance it would be much easier to understand
Thank you
Technical analysis is good to learn that helps more on the trading.. well explained
You are right brother....
https://x.com/ChimaJonn/status/1816241866905391509?t=WC4SIyQCJbyL7krSmgSj1Q&s=19
Thank you so much brother, you have really explained the concept of support and resistance so well. You explanation is spot on, keep it up.