STEEMUSDT Breakdown
I will be breaking down the price chart of steem against usdt today and what's being happening and what we can likely expect.
The market is gradually showing sign of recovery and we are about to end the Q3 into Q4 the last quarter of the year of which we bullish action is rightly expected so if at all the market is going to begin slowly going back up then there is no better time than the present and I rightly believe that's where we are headed to despite any bumps we might experience on the way, it's a bull run season after all it's only a matter of time.
There is news of micro strategy recently increasing their Bitcoin holding still doubling down so there is no doubt institutions are still buying in massively into cryptocurrency and that's a good sign as a Bitcoin price surge is exactly what the market needs.
I will be looking at steemusdt from the weekly timeframe then onto the daily to know what one could expect within the foreseeable future.
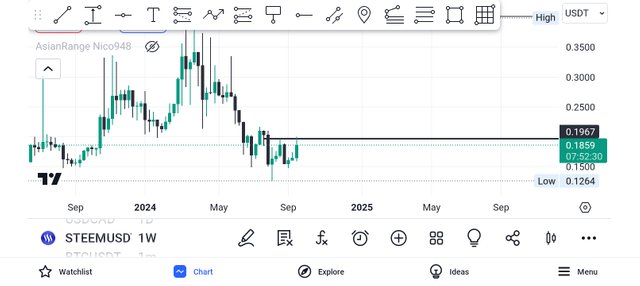
Screenshot from trading view
Well from the weekly we are currently testing a weekly high on the price chart and have already wicked above but am expecting a good break above to signal good bullish signs, the weekly high is at $0.1967 if we can break above there it would be really positive for steem.
The weekly candle already wicked above hopefully a good confirmation would be if the next weekly candle were to close above the high with a body close if these one fails to properly break it, if that happens it would be a nice indication of bullish price action soon.
And looking at the weekly chart also you will see that a successful break above the $0.1967 level would also indicate a proper W pattern formed on the weekly with the kneck line around $0.1967 and breaking above would be a W formation breakout of which we might see a retest of the level before price surges even higher.
And in an event we break out we might be looking at the next weekly swing high as a target at almost $0.41 level which would be nice though I would first expect price draw to an fvg around $0.26 level, for further confirmation if we are bullish I drop down to the daily to observe.
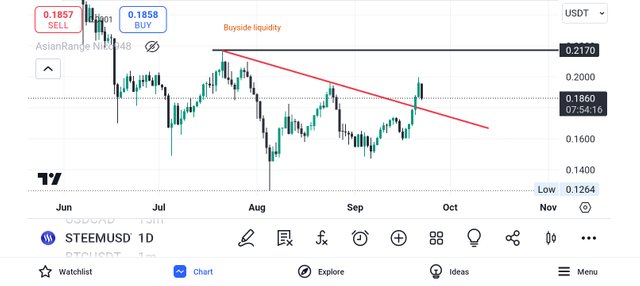
Screenshot from trading view
On the daily timeframe we noticed the trendline resistance that price has seemingly broke above of in the chart as depicted just right above, a buyside at $0.2170 level which is also the trendline high would be an ideal target for that breakout in the immediate short term.
We have seemingly broken out on the daily from that pattern rather strongly and price seem to be retracing, well there is no suprise there and such retracement could be likely to restest the previous resistance level which would flip as support in an event price wants to keep pushing higher though naturally I believe that's the likely scenerio to play out and even if we dip further below then the orderblock could serve as a support.
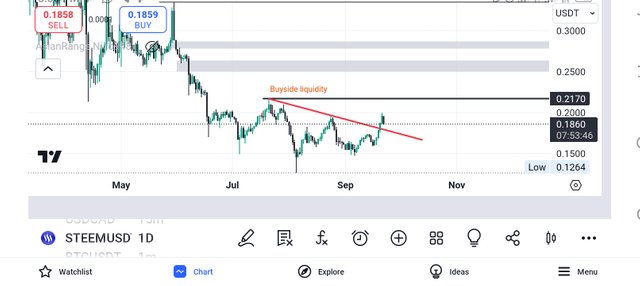
What levels are my expecting price to reach to after a retest and successful confirmation we are headed upwards, well the first target would be taking out the buyside liquidity at $2170 followed and price could start reaching towards the $0.26 price level where there is a fvg and then another one around $0.29 and possibly to much greater high.
Though the immediate target from that breakout is $0.2170 I see us reaching there soon with successful restest of the trendline resistance and $0.26 is also cleary with in sight.
This is my thoughts on steem, I urge all looking to invest to carry out their own research and shouldn't see my post as financial advice.
Upvoted! Thank you for supporting witness @jswit.
https://x.com/frank_anayo/status/1838016596758974878?t=-RYQ5FPAR53ArmceHl5GXw&s=19
STEEMUSDT Breakdown is an informative post. Thanks for sharing.
Nice analysis about steem price. Thanks for sharing. Hopefully steem price will be increasing soon