ICHIMOKU KINKO HYO ( AN ALL-ROUND INDICATOR) by @cutlass || 10% to tron-fan-club
Hello everyone my name is Oshoke and in this post, I will be taking you through Ichimoku Kinko Hyo a very much effective and all-round trading indicator
Ichimoku Kinko Hyo is a technical analysis indicator that does not only reveal the market prices, trends, support, and resistance it also predicts to some extent the direction of price trends where it will be in the future when to exit and more, the chart although a little bit complex offers lots of information from just a glance on the chart. The Ichimoku Kinko Hyo translated in English means Ichimoku= One glance, Kinko = Balance and Hyo stands for Chart is a chart developed in the 1930s by Goichi Hosoda with the sole purpose of displaying more pieces of information on a chart like entry and exit signals, support and resistance, and momentum in just a glance.
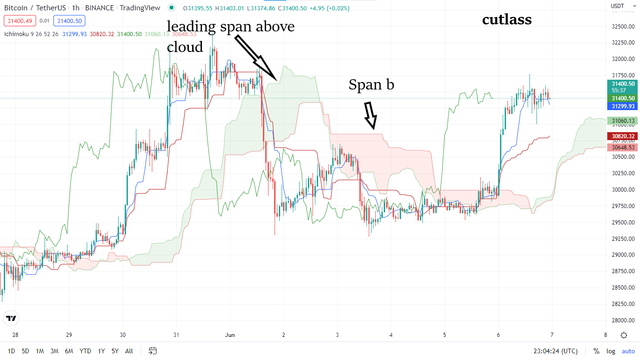
The Ichimoku Kinko Hyo is formed between two lines known as the Leading Span and the Lagging span otherwise referred to as Senkou span A and B. leading span A is a line that forms the top of the cloud which is basically gotten when one takes the tenkan san(Fast moving average) which is a total of 9 periods averaged out with the Kijun san (Slow moving average) which is a total of 26 periods and what this does is it gives you the price action in the market from the past 14 periods while the Span B is formed beneath the Cloud and it is Plotted usually by averaging the highest highs from the last 52 market movements/periods and the lowest low of the last 52 period
The senkou span A works in hand in hand with the senkou span B and due to the fact about how it is plotted it responds much more quickly to market price changes, when the Senkan Span A is seen to be above the cloud it indicates that the market is in a bullish trend on the contrary when it is seen beneath the cloud it suggests that the market is in a bearish trend while if the If the Senkou Span B is seen on top of the cloud the trend is then considered to be a Bearish trend and vice versa
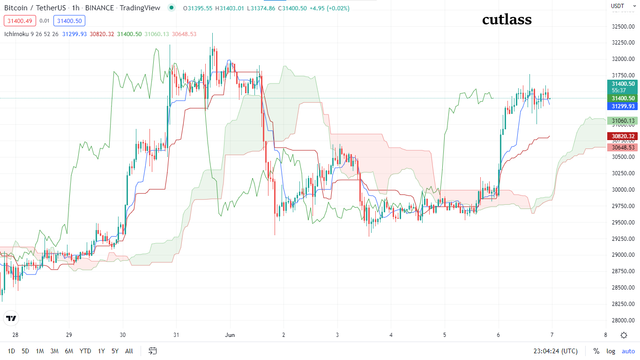
The Ichimoku clouds can help one tell price movement and can both give a general sense of market trends when one glances at the chart he can from both perspectives I.e the cloud and the price movement tell in what direction the market is going when the cloud is seen to be green we can tell that the market is bullish while when the cloud is seen to be red the market is in a bearish direction as we can tell from the screenshot above
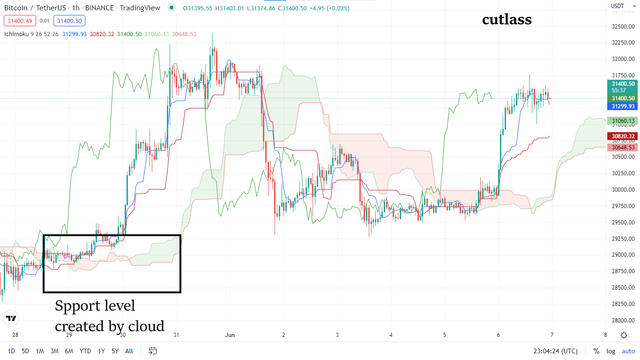
ICHIMOKU SUPPORT AND RESISTANCE
The Kumo's traditional support and resistance level take quite a different approach than other indicators do, how thick or thin the space between Span A and B indicates market/price volatility I.e if the cloud is thick(widely apart) this indicates high resistance and support in the market which in turn says that the market prices should be expected to continue in the current trend it is currently on the contrary if the Kumo cloud is seen to be thin(closely together)it indicates low volatility which means the support and resistance level is not very strong which in turns say that market price is not to be expected to follow a specific pattern and in some cases of thin clouds prices tend to penetrate the Kumo clouds.
SOME BASIC USES OF ICHIMOKU CLOUD
- It can be used to predict future direction of market price
- Used to set stop loss and take profit
- Set entry and exit positions for trades
With the Ichimoku Kinko Hyo with its help, a trader can to some extent determine the direction of price flow and a lot more other information by just glancing at the chart. Knowledge is power in cryptocurrency the more information an individual has the more likely he is to succeed in a trade.
p.s all screenshots used were gotten from Tradingview
Tweet link
https://twitter.com/brat_man11/status/1533965500845154304?s=21
Thank you for sharing friends, I hope this is useful for many people.
Thank you too for sharing your thoughts