SIZ Education | Does journalism help Performance Reporting and Business Dashboards?
What can every business analyst learn from a journalist?

Business analysts understand how to use data better to really extract insides and then communicate those insights effectively. And it's the last step that lets lots of business analysts down.
We're quite good at collecting the right data, turning this into great insight, but it will not impact us if we don't communicate this effectively.
So we can learn from what journalists do because if a journalist is investigating a story, they will collect data, conduct interviews, do lots of things, collect this data, and then package it in a way that we can easily understand.
So they don't just give us all the raw data, which is happening in so many companies when business analysts collect data. Instead, we dump all of this data into reports or dashboards, or spreadsheets and then give it to some decision-maker. So you find the answers.
Journalists don't do this; they will create a newspaper's front page, which basically has three key components to it.
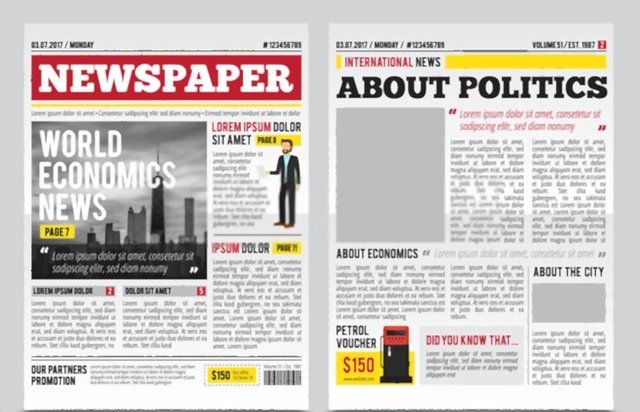
- as a headline that tells you exactly what happened,
- it then gives you a picture that puts the headline into context
- and then it will give you a short narrative basically telling you the key facts of this story.
So if you've gone to the newsagent and you look at the newspapers and read you read all the newspaper front pages, you get a pretty good feel of what is currently happening in the world or a new part of the world.
How do businesses take inspiration from journalists while preparing Performance Reporting and Business Dashboards?
I don't feel that businesses use this tactic; we have many business reports and lots of dashboards, but nobody really understands the key messages. The reason is that we don't learn from what journalists do.
So I believe we need to bring those three elements into our business reporting. we are telling stories, but we need to create headlines saying, “this is what the data is telling us.”
We then need to bring in pictures, i.e., really good data visualizations that turn the data into something people can understand.
Then we need to bring in narratives that basically capture the essence of the story, saying (putting the data into context) saying “this is why we've got these results; these are the implications of these results.”
The Corporate Newspaper
One of the biggest media companies created a corporate newspaper and called this “pop,” standing for “perspectives on performance,” and they now have this magazine front covers particularly; what works well is when you have headlines that include numbers and are somehow what they call benefit orientated. So you need to understand this.
So what they're now doing is they're putting onto the corporate newspaper their performance report. For Example:
- The three things that came out of our staff survey
- The five financial challenges for the next quarter
And then you open this up, and then you get then this newspaper front page style report with the headline with a good graphic or good data visualization and a narrative and surprised people really understand what is going on in the organization.
And the media companies are creating these ditches to a tabletop. So if you go near the water cooler and sit down, you have these digital tabletops, so they detect that you've just sat down, but it spins around pop; you can find out what the three things that came out of our staff survey are?

You then get this opening up and get the headline, the narrative, the picture, and what you're doing here is you're controlling the corporate narrative because people really understand the inside. So then these stories get told and retold.
And everyone in the organization suddenly understands what is going on and what the priorities are what the insights are.
The organizations collect and use this data more effectively and then communicate this data effectively to really drive better decision-making.
Big time!
Peace out!
Image Credits: shutterstock.com