SIZ Tutorial || How to CREATE Heat MAP In the EXCEL || 20% payout to siz-official
Greeting to all.
I hope all Good and enjoy the healthy lives. I am also good.
So today i am make the some different tutorial. The Tutorial is How to make the heat map in the EXCEL. Some time you want to make the maps but you can't draw the map. In this post i will teach you 3(three) type of the maps.
.png)
When you can go to the google and where you can see the heat map, but you cannot make this type of the map
The example is type of the picture you can see below
Like As.
- One Column
- Two Column
- All text/Column convert to map.
So Lets Start
When you can go to the google and where you can see the heat map, but you cannot make this type of the map.
The example is type of the picture you can see below.

- The picture you can see this type of the heat map are also make the EXCEL. I think so many people are not know about this type of the map.
| Step 1. | First you can go Excel Sheet, and where you can see the empty page we are not require the empty page. Whatever TEXT you want to make the Heat Map. In the below picture you can see this an empty page but it is not require. |
|---|
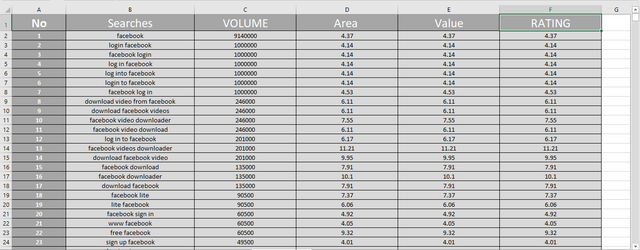
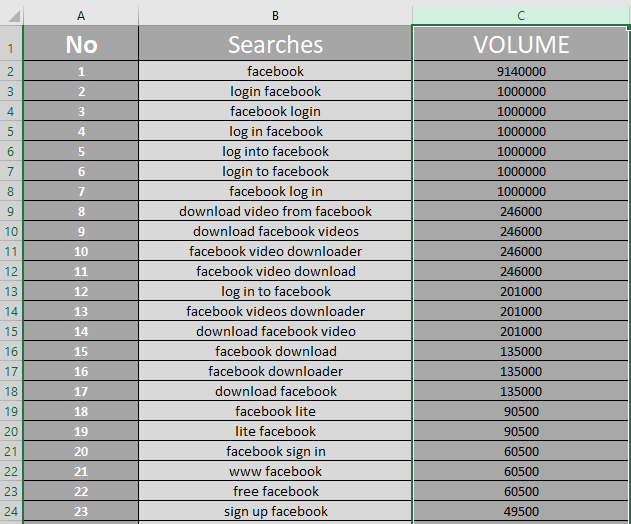
| Step 2. | In this step you can enter your data Whatever you want to make the map. It is not a rocket science. In the below image you can see i am enter my data to make the MAP. |
|---|
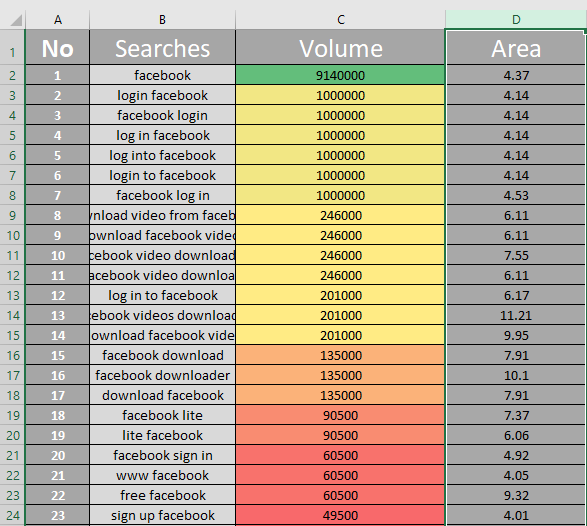
| Step 3. | After entering your data you can select the ONE COLUMN i am select the volume column, after selecting you can go up mean scroll upward you can see the Menu Bar. Where you can see the many types of the EXCELS OPTION. You can see the CONDITIONAL FORMATING OPTION. |
|---|

| Step 4. | Selecting the data and click the conditional option. When you can click the Conditional formatting option you can see the many type of the options. You can click the Color scale. |
|---|
.png)
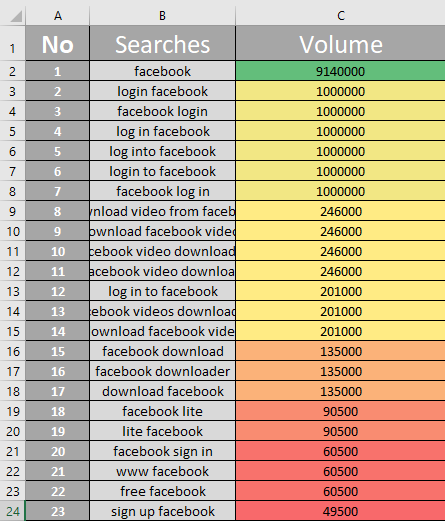
- When you can click the color scale you can see the many type of the color whatever you want you can chose the color.
Apply the color on the VOLUME COLUMN.
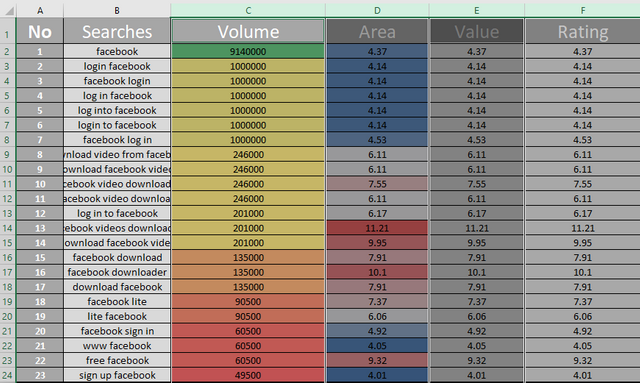
After TWO Column coloring picture.
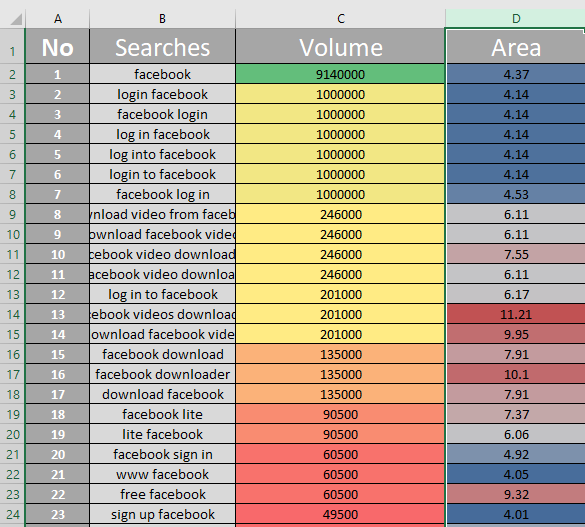
| Step 5. | In this step again Selecting the data and click the conditional option. Click the Conditional formatting option you can see the COLOR. You can click the Color scale. |
|---|
- In the above picture you can see i am select the AREA Colum. Also i am apply the COLOR on this column.
After One Column coloring picture.
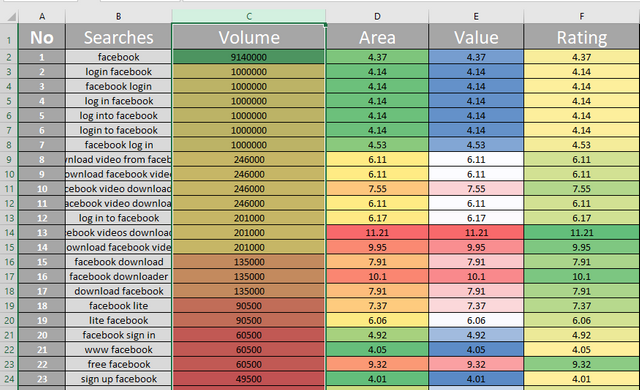
| Step 6. | In this step i am select the all Columns and click the conditional formatting option. Click the Conditional formatting option you can see the COLOR. You can click the Color scale. In the below Picture you can see. |
|---|
- Now I am apply the coloring area all of the tables. In the below picture you can see.
After ALL Column coloring picture.

I hope you like my POST & and also you can solve your problem.
And also give your feedback
20% payout to siz-official.
Special Thanks:
@siz-official
@cryptokraze
@vvarishayy
@suboohi
Regard.
ACHIEVEMENT O1

Good post brother
Wlcm bro
Good post dear friend keep it up.
And keep learn with our steem fellows.
Regards, Faran Nabeel
Thank you brother