The Boldest STEEM Prediction for this Bull Run!
Hello and welcome to episode 12 of TA (Technical Analysis) Today we are diving into the STEEM Token!
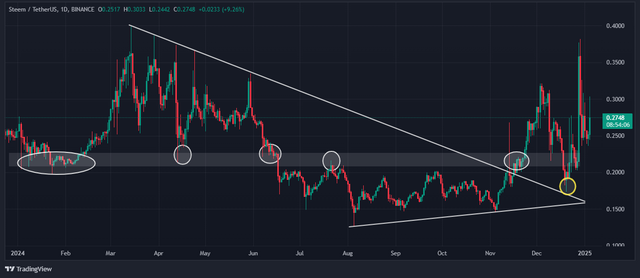
Do you remember my analysis of the Steem token from a few days ago? Where many analysts were finding the chart weak and people were panicking, we discussed the yellow circled area in the screenshot below as key support and from there within a few days we also saw strong buying in this token.

Source 1Day timeframe.
Although the price did not hold at higher levels and the selling pressure brought the price down again but in this tension between buyers and sellers, we have seen another new trend along with beautiful price actions.

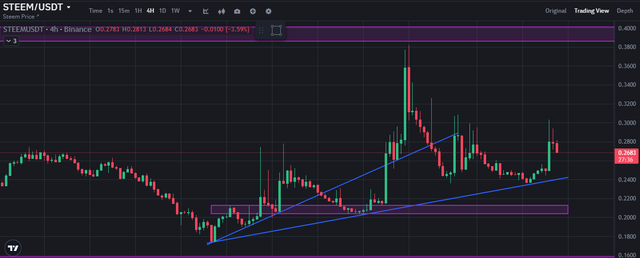
Source 4Hour timeframe.
In the above chart, you can see a higher-high price formation on which 2 blue trendlines are drawn. The lower blue trendline is acting as an active support from where we saw buying momentum in this token just yesterday and taking that momentum forward, today we saw an up move of more than 20%. However, the pressure from sellers at the upper levels has once again brought the price down, but after yesterday's momentum, today's follow-up shows the increasing interest of buyers in this token and at the same time we can now say that if the price closes below this lower blue trendline once again in the daily timeframe, it will be a direct blow to the confidence of the buyers, after which this token will again become sluggish for some time. And the confidence to move higher from here will be strengthened when it gives a closing above 0.30.
But for the move of $1 and beyond, let me show you the bigger picture, there you will find more interesting information.

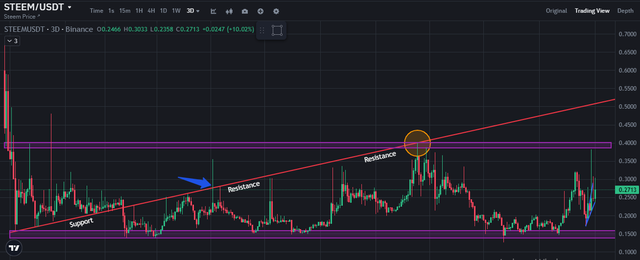
Source 3Day timeframe.
There is no special reason to analyse with 3Day timeframe, I just wanted to show you the complete price action in one screen with maximum candles and this timeframe was perfect for that. So in the above screenshot, you are seeing the price action from 2022 till now. In this, you can see 2 purple-coloured support and resistance areas between which the price has been dancing up and down since 2022. In which most of the time the price has been moving downwards under pressure. But this area is also of almost 150% from support to resistance, so we cannot say at all that there was no opportunities to earn in this somewhat sideways market.
But now that we have started talking about the bull run, it is very important for us to know at what levels the price may face the maximum pressure while moving upwards. In the above chart, you can see a red trendline which is drawn diagonally from left to right, it started as a support after a huge fall in the price in 2022 and acted strongly as an important resistance since then.
The price last touched this trendline in March last year and even then we saw selling in this token with a proper lower-low structure, the top at that time was around 0.40 and last week itself we saw the highest price of 0.38 in this token after which once again the selling in this token intensified. So the first level as resistance is 0.40 only after which 0.50 can act as a psychological level but we do not know when the price will reach there, so I personally am going to look at this red trendline as an important level apart from 0.50 because at higher levels often the pressure increases due to profit booking but if buyers absorb that pressure and hold the price at the upper levels then it will be a preparation for an even bigger move.
Upvoted! Thank you for supporting witness @jswit.
I am so much anticipating and optimistic that hive will definitely hit more than the 1 dollar mark this year and that is why we need to start preparing and actually planning ahead
That's what a trader does in his daily routine, planning ahead. : )