HIVE ANALYSIS - Something that you might have missed!
Hello and welcome to episode 13 of TA (Technical Analysis) Today we are diving into the HIVE Token!
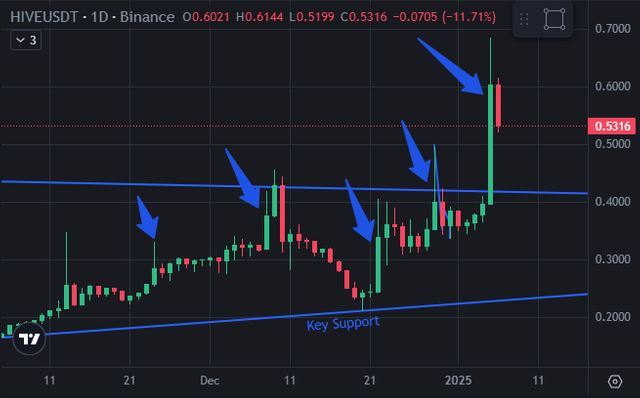
Yesterday while analysing the chart of Hive I noticed an important thing. Look at the price action of the last almost 2 months on the daily time frame. In the below chart except for the first big candle on the left side, every time the big move in the price has come on the weekend and then a base build-up with volatility squeeze in price during weekdays and then another big move on weekends. I have marked those moves with blue arrows and you can also check it yourself on your Phones or PCs.

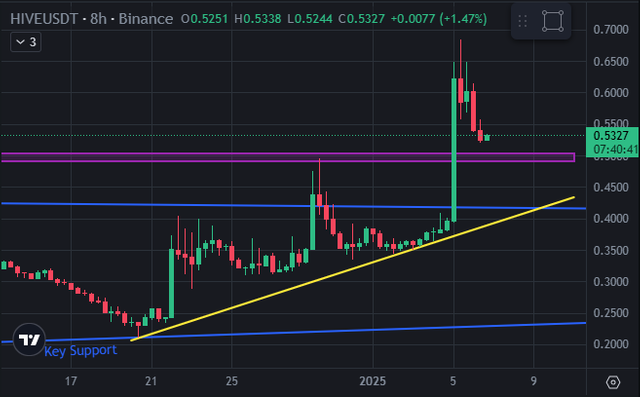
Apart from this, if we look at a slightly smaller time frame than the daily (look at the image below), it can be understood that the highlighted purple area near 0.50 can act as an initial support in the current pullback and if buyers are unable to establish their dominance here. Another important support can be seen forming near 0.43 on the yellow trendline.

However, if you see the first screenshot of this post, you will find that I have drawn a blue trendline as 'Key Support' far below, according to which the support is roughly around 0.25 and it is still maintaining its place. But since yesterday we saw the price closing above important levels in a wonderful movement, now it will be very important for the price to remain above 0.42 or precisely 0.40 to maintain the dominance and importantly the confidence of buyers in this amazing trend in HIVE.
Upvoted! Thank you for supporting witness @jswit.
Thanks for sharing this valuable analysis with us