How candle formations can help you trade better as a beginner in the crypto market
Traders rely a lot on reading charts in order to determine what to do with their current positions in the market.
When reading charts, there are things to look out for that will serve as a signal to help choose whatever action we are going to take in the market.
One of the things to look out for on a chart is the candle formation of the coin we are going to be trading.
Candle formations help to pinpoint exactly which type of trend the market is currently going through.
There are mainly two known types of trends in the market
- Uptrend
- Downtrend
In an uptrend market, the price of the asset being monitored keeps moving up.
In a downtrend market, the price of the asset being monitored keeps moving down.
A very clear indicator of a trend in any market is the formation of highs and lows among the candles on the chart.
In order to understand how you can use highs and lows to identify trends on a chart, we have to first understand these two concepts
- Higher lows and higher highs
- Lower lows and lower highs
Higher Lows and Higher Highs
In an uptrend where the price of an asset is on the move up over a certain timeframe the candle bars on that type of trend are what we usually refer to as higher highs and higher lows.
The closing price of a candle for any given period of time would determine whether the candle stick would point up or whether the candlestick would point down.
When a candlestick close and points up in an uptrend it is known as a higher high, when it points down in an uptrend it is known as a higher low.
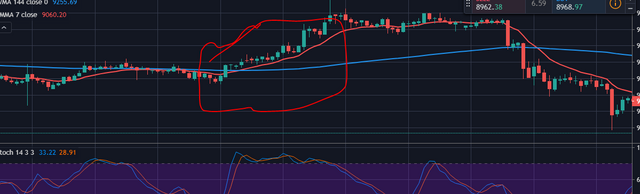
The area circled in the image above is an uptrend that forms a higher high and higher low.
Higher highs and higher lows are mostly indicators that it is time to take profit.
Lower Lows and Lower Highs
These candle formations are usually found in a downtrend as opposed to the one we described earlier.
Lower lows and lower highs occur when the price is falling on a chart across different timeframes.
A lower low occurs when the price closes with the candle pointing down in a downtrend market.
A higher low occurs when the price closes with the candle in an upward movement on the chart.
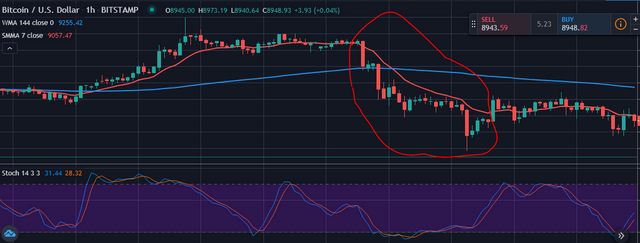
The circled part on the chart above is a downtrend whose formations shows a set of lower lows and lower highs.
The green candles in a downtrend are the lower highs while the red candles in a downtrend are the lower lows.
Formation of lower highs and lower lows on a chart indicates that it might be the best time to buy in preparation for a possible uptrend.
It is important to be able to understand what a candle formations is saying about the market, for easy trend identification.
@tipu curate
Upvoted 👌 (Mana: 12/20) @swap.app - quick steem <-> sbd swaps