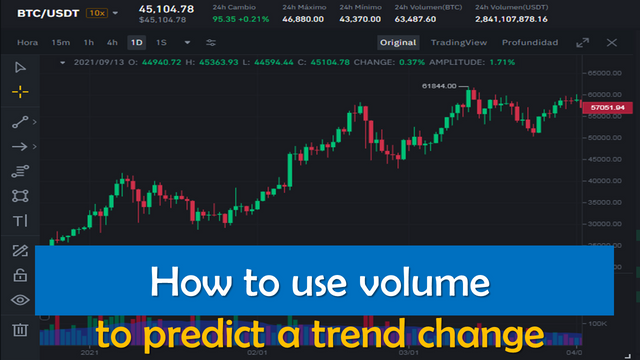
How to use volume to predict a trend change

Introduction
Greetings dear readers and followers, with this post I will continue my series of articles about the wonderful world of trading applied to the cryptocurrency market, this time I will address key aspects of how to use volume to predict a trend change.
Finding the link between volume and trend is based on the fact that volume as a technical indicator guides us on the selling or buying pressure that is developing at a given time in the market, therefore, volume can be used to predict changes in the price of an asset or any other financial instrument.
As mentioned in the previous paragraph, volume will allow us to determine the strength or weakness of a trend, i.e. to predict when the end of a trend is near, and thus provide us with an orientation on the probable change of trend, either upward or downward.
Change in trend
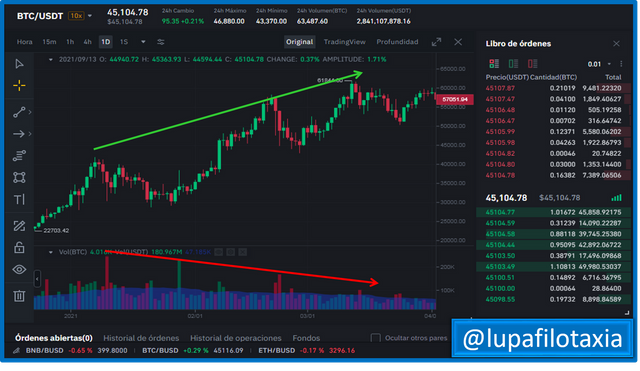
A simple way to predict a change of trend, for example; from bullish to bearish when using volume as an indicator, is to visualize on the chart that the volume columns begin to decrease (go down) significantly, this is basically due to the exhaustion movements, which reveals the end of the uptrend, and therefore the beginning of a downtrend.
In the following chart, I share with you a visual demonstration of the trend change in the BTC/USDT pair, where you can see the typical divergence pattern of volume in opposition to high prices, a behavior that from a technical point of view indicates a trend change from bullish to bearish.

It may be that for most traders who are active on our blockchain, these fundamentals are simple and easy to understand, however, many content bloggers have not mastered these basic notions about the effect of volume on trend changes and we aim to make this material for this second group of users.
In the next post, I will share more details of the multiple signals that we can find when trend changes are generated, using volume as an indicator.

SOURCES CONSULTED
➊ Steven N Using Trading Volume to Understand Investment Activity. Link

OBSERVATION:
The cover image was designed by the author: @lupafilotaxia, incorporating image: Source: Investmentu

