Easier way to enjoy Bitcoin story.
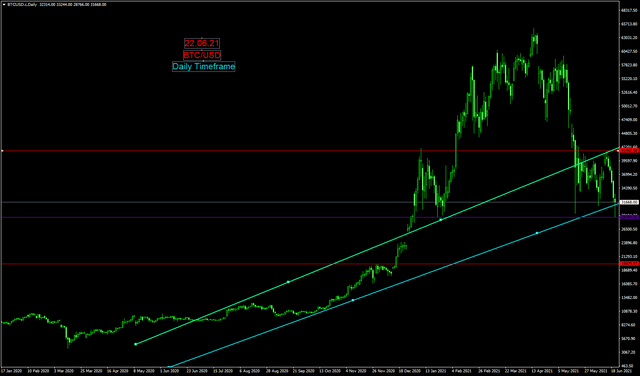
The following chart is of BTC/USD chart on the daily timeframe. I prefer a larger timeframe when analyzing an asset for the longer-term trend, recently we have seen BTC rally quite a bit since the $17,500 level in December 2020. Since then it has seen a new all-time high of $64,000 (might vary depending on the exchanges), which's a very significant gain. Currently, we stand approximately -50.75% from all-time high.
While analyzing charts, I look at it like a story being told, trading days represent chapters, the trend is the plot or thesis, key support and resistance is the conflict, and the current price is the resolution. There are a lot of aspects to it but the main ones any financial buff will emphasize are technical, fundamental, and market sentiment. Closely monitoring these 3 aspects you can get accustomed to the price movements. We have to look at the story and formulate ideas that can play out in the market using critical thinking skills.
Digesting mainstream fundamental business news flash can send shockwaves through the market because millions of traders are digesting it and making the market move based on their actions collectively. The recent unfolding of the Chinese crackdown on bitcoin miners has harmed the price of bitcoin.
Investors should exercise their critical thinking and dive deep into the happenings around them and connect dots from the technical aspect and market sentiment. The chart consists of a long-term channel represented by the aqua lines which is the plot. The purple horizontal line which I believe is the main PIVOT level can be classified at the plot in our story, and red lines representing major support and resistance levels represent the conflict. This technical chart represents key BTC trading levels based on critical support and resistance levels, any levels that have been tested, rejected, broken multiple times can indicate that large orders are being executed on the exchanges.
Technically speaking $30,000 is a key psychological level, it was breached recently and bounced back above it rapidly as buyers poured back into the market resulting in a price knee-jerk up. The recent low of $28,764 will play as a key support level in the coming trading days if the market is range-bound.
Trading can reveal a lot about yourself, you can experience various emotions in a short amount of period, this will help to better understand yourself and the market. You will know when you are over risking when you are greedy and what trading style suits you. Key points to be mindful of are don't get greedy, emotional, have a game plan (risk management), and don't get attached to your positions.
We have to understand in today's day and age highly advanced algorithms are participating in the markets amongst us. We can't control them but we surely can control our trading system to maneuver through the markets. Traders have to use the tool available for us to formulate a trading vision and plan.
Seeing the market as a story, we can potentially foreshadow the next chapter. So go on sit down and remember that no matter what chart or price action movement you are investigating, just know that it's a beautiful story and enjoy it.
DISCLAIMER: This is not financial advice, this is for entertainment purposes only.
@inthegreen hi, I think we are in a fourth wave and it is the best time to buy and wait.
Definitely, dollar cost average on buys for long term hold.