technical analysis BTC

Happy day to all the passionate community in the area of Project HOPE once again creating life and sharing content for its readers, firstly I offer my sincere apologies for the unforeseen disappearance of a couple of days ago, resuming the constancy and dedication that I try to reflect in each of my contributions to the blockchain without anything else to add let's start with the post......

Crypto Market Projection
The last few days the quotes of major currencies such as Btc, Bnb, Eth have been in situations of indecision and lateralization, as it fails to define its position in the market, BTC presenting strong sales once it touches 38K or 39K dragging the asset to support itself in the line of 28 to 29K "We know it is not just about buying cheap and selling expensive" it is about understanding the market and trade for profit, try not to lose money and if you missed with your prediction holdea, just be patient and stay calm
Trading is not simple "It's real money that you are willing to risk" the market is designed for natural people like you or me to lose our money while the exchanges, institutions and all those at the top of the food chain, can feed on our losses and accumulate every time the price is manipulated.
Technical Analysis
Basic technical analysis has become a bid for example momentum dominance:
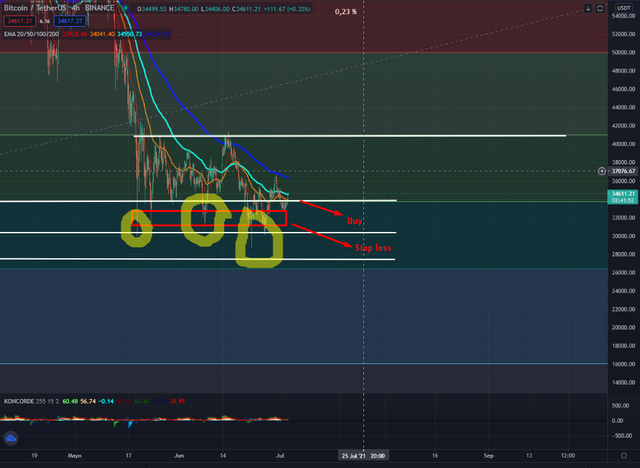
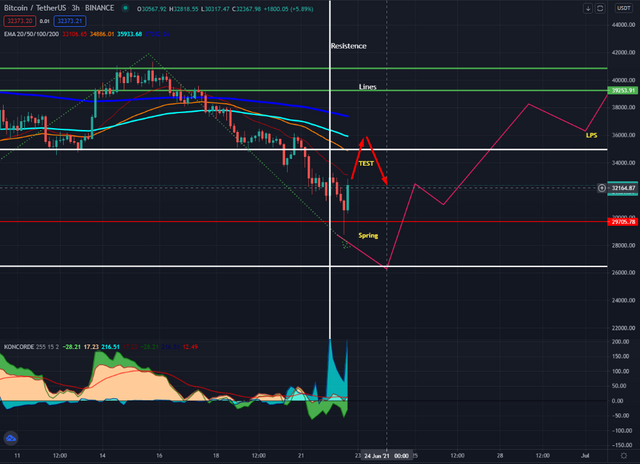
The first line drawn in temporary charts of a month is a support turned into resistance where great strength is needed to break and ascend above the box, a situation that is not yet present, the second line just like the first is a support turned into resistance in temporalities of a week where this is reflected as target, partial selling point whenever market situations are taken advantage of, purchases below 30k the red box is where the stoploss should be set in case of a rejection or continuation of the momentum. The desecration of this support I highlighted with a yellow circle to highlight. The last resistance is where I personally would place my stoploss .
I will explain why ...
The composite man needs to detonate the price down to accumulate as much as possible, if all the traders or retail trader of short trends reveal where their stoploss is, consequently the exchanges and institutions that have great purchasing power will bet for the fall of the price for them to take liquidity and we will close in losses. Personally, these are my criteria
- I place alarms to indicate when to enter and exit the market.
- I do not reveal my targets or my stoploss.
- I do not leave short entries open while I may be in off hours.
- I do not place auto executable targets for profit taking, I am a trader not a fortune teller.
It should be noted that I am not your financial advisor, and you are not under any obligation to follow my trading, each trader operates under his own terms, in short, you will be the only responsible.
Let's get straight to the point
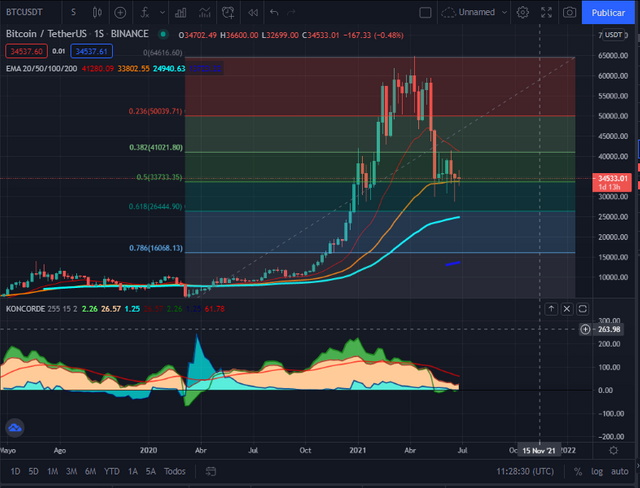
Cumulative pattern, very similar before its ascent to 60k, long wicks reflect supply and demand for either a good sell or a good buy, who buys and who sells? It is the million dollar question ...
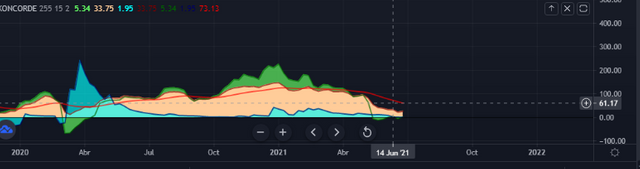
There is a small bid by institutions incentivizing the crisis and desperation to cause retail sales, every time bitcoin falls below 29k Demand eats supply in short time frames presenting corrections up to 32K onwards, taking into account 2 criteria if we are in cumulative stages and the price does not have enough liquidity to burst and burst the 38k line Who is driving the price up and does not possess the necessary investment power to fight the supply and keep up? Exactly, retail. How do I know? Simple, the indicator shows blues above with large size and greens below with little body meaning that institutions will go to great lengths to buy below 27k.
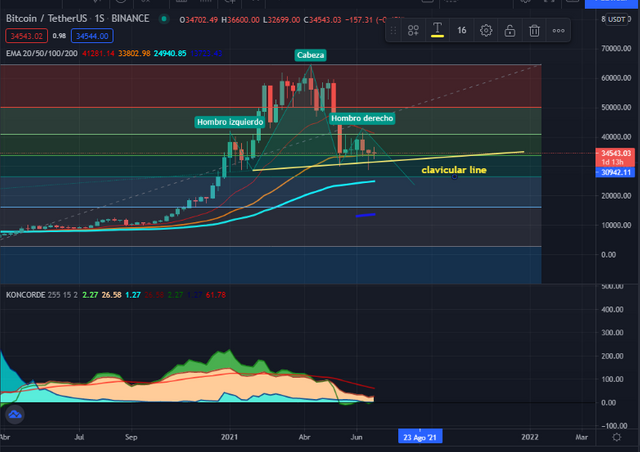
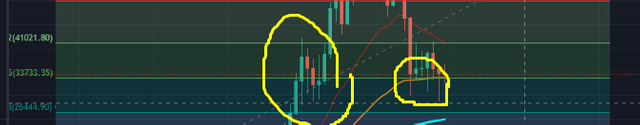
Confirming with this shoulder head shoulder pattern that can be a sign of a possible trend change (downward breakout), correction point 26k, but remember that the standard configuration of this retracement can be counterproductive for those who operate with automatic stoploss, touch and collect, they go for your money, take precautions.
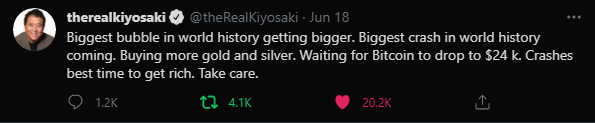
This great influencer claims he can buy btc at 24k and I believe him ... The author of rich daddy poor daddy, great example in the investment world Why 24k? The support line is at 26K there is something that I like to call
Food zone or congestion is when the supply reaches for a short period of time the maximum point of liquidity allowed by the momentum and this movement is repeated and repeated It can be understood as a OB


@tipu curate
Upvoted 👌 (Mana: 2/6) Get profit votes with @tipU :)
Thank you for reading