Blockchain and Cryptocurrency Advanced - How to Read the ATR Indicator and Combining the ATR indicator and the RSI indicator

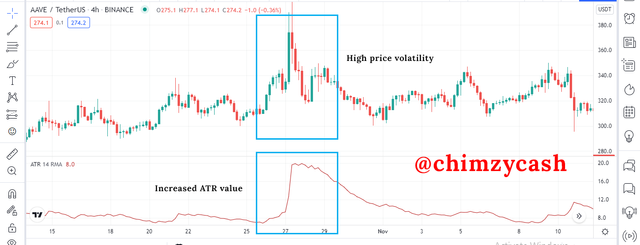
When it comes to reading indicators on a chart, the ATR indicator is one of the easier indicators to read even for beginner because of its simplicity and easy to understand. Since the ATR indicator measures the market volatility or price fluctuations of any cryptocurrency asset at any particular period, it is much easier to read the ATR indicator because areas of high price fluctuations or market volatility on the candlestick charts which usually has large candlestick bodies, reflects on the ATR values which also shows high ATR values and areas of low price fluctuations or market volatility on the candlestick charts which usually has small candlestick bodies reflects on the ATR values which also shows low ATR values.
.png)
AAVE/USDT Chart
Looking at the AAVE/USDT chart, we can clearly see that the high volatility area on the candlestick chart which has large candlestick bodies, reflected on the ATR values which shows high ATR values. When the ATR value is increased, it is an indication of high market volatility.
.png)
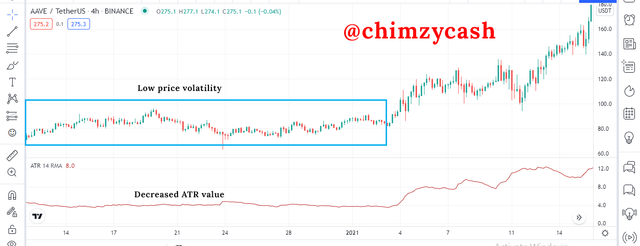
Also, we can clearly see the low volatility area on the candlestick chart which has small candlestick bodies, reflected on the ATR values which shows low ATR values. When the ATR value is decreased, it is an indication of low market volatility. The candlestick chart shows that the area of low volatility is the area where the market was moving sideways or ranging. This signal can be used to make good entry or exit decisions when trading.
AAVE/USDT Chart
Combining the ATR indicator and the RSI indicator
Even though the ATR indicator is a very powerful technical indicator on its own for measuring market volatility and price fluctuations in the market over a given time period, it is also very important to combine it with other technical indicator for better reading and effective indications because there is no indicator that is perfect in its signals and there is always false signals. RSI is a very good and common technical indicator that can be used in combination with the ATR indicator for more effective indications.
The RSI indicator is basically a momentum indicator that indicates overbought and oversold in the market. The RSI oscillator line moves between 0 and 100. 30 and 70 are the main values of the RSI indicator. When the RSI oscillator line moves below 30 value, it is an indication that the market is in oversold, and when the RSI oscillator line moves above 70 value, it is an indication that the market is in overbought. When the price ranges between 30 and 70, it is an indication that the market is neither overbought or oversold and is neutral.
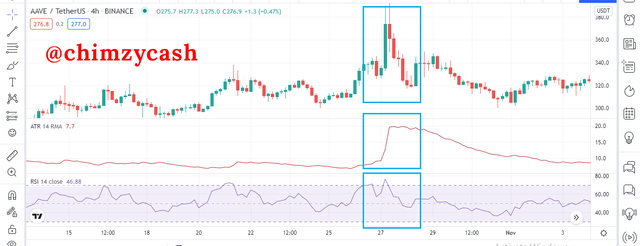
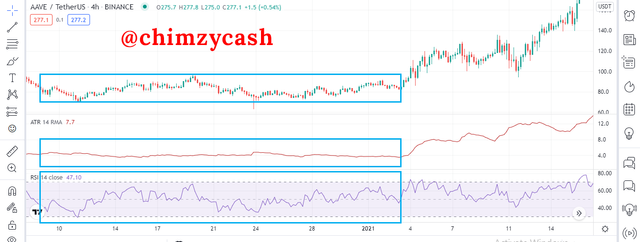
The RSI can become useful in combination with the ATR indicator because if the RSI value is above 70, there is a strong possibility of reversal in the market as there will be more sellers in the market selling to take profit. This would reflect in the ATR as high volatility since there will be rapid price movements. From the chart, we can see that the area where the ATR indicator has a high value and indicates high market volatility, the RSI indicator indicates an overbought and what followed next was a price reversal. Also in the area of low volatility in the market with small candlestick bodies ranging, the RSI indicator also indicates a ranging market with the oscillator line ranging between 30 and 70 values.
.png)
.png)
