What are Bollinger Bands and how to use them in trading?

Bollinger Bands are a technical analysis tool used to measure the volatility of an asset and determine whether it is overbought or oversold. They were developed by John Bollinger in the 1980s and have become a popular tool among traders and market analysts.
Bollinger Bands are constructed from three lines: a simple moving average (SMA) and two standard deviation lines above and below the SMA. The SMA is calculated as the average of the closing prices over a given period, which is usually 20 days. The two standard deviation lines are calculated by adding and subtracting twice the standard deviation of the closing prices from the SMA.
The idea behind Bollinger Bands is that prices tend to stay within the bands most of the time, but can temporarily move out of them during periods of high volatility. When prices are near the upper band, the asset is considered overbought, meaning that buyers have pushed the price too high and there may be a downward correction. On the other hand, when prices are near the lower band, the asset is considered oversold, which means that sellers have pushed the price too low and there may be an upward correction.
Bollinger Bands can also be used to identify mean reversion patterns. When prices move out of the bands and then back into them, this can indicate that the asset is returning to its average value and can be a buy or sell signal.
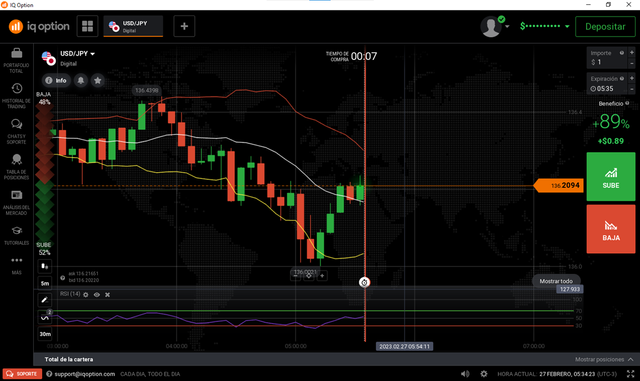
Source: Screenshot of iq option broker
Another way to use Bollinger Bands is by analyzing the width of the bands. When the bands narrow, this can indicate that price consolidation is occurring and a breakout in either direction can occur. On the other hand, when the bands widen, this may indicate that volatility is increasing and that there may be a trend in the direction in which the bands are widening.
It is important to remember that Bollinger Bands are only a technical analysis tool and do not guarantee trading success. Traders should use them in conjunction with other indicators and analysis to make informed trading decisions. It is also important to note that Bollinger Bands are not suitable for all assets and time frames, so traders should experiment and find what works best for them.
In conclusion, Bollinger Bands are a valuable tool for traders and market analysts looking to measure the volatility of an asset and determine whether it is overbought or oversold. They are easy to use and can be used in conjunction with other indicators and analysis to make informed trading decisions. However, it is important to remember that Bollinger Bands do not guarantee trading success and that traders should experiment and find what works best for them.