Technical trading indicators: a guide to making informed financial market decisions.
Technical indicators are a popular tool in the trading world, used by traders in all types of financial markets, from the stock market to the foreign exchange market. These indicators can help traders analyze market trends and make informed decisions about when to buy or sell an asset.
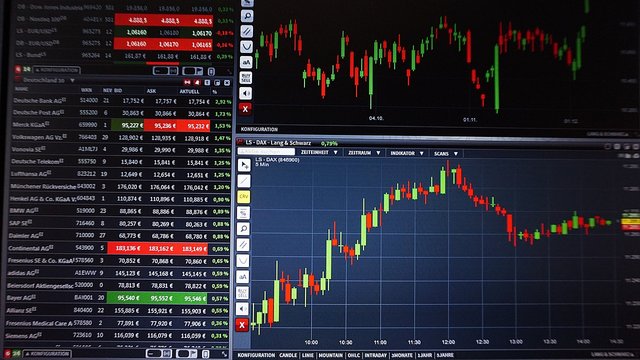
Technical trading indicators are based on the idea that market prices move in predictable patterns, and that these patterns can be identified by analyzing historical market data. These patterns can provide valuable information about the future direction of the market, and traders can use this information to make trading decisions.
One of the most common technical indicators is the moving average, which shows the average of an asset's prices over a given period of time. Traders use moving averages to identify market trends, as they can help smooth out daily price volatility and provide a clear signal of market direction.
Another popular technical indicator is the relative strength index (RSI), which measures the strength of a trend and can help traders identify entry and exit points. The RSI ranges from 0 to 100, and an asset is considered overbought when the RSI rises above 70 and oversold when the RSI falls below 30.

Source
Volume indicators are also popular with traders, as they can provide information about the amount of activity in a market. The volume indicator can help traders identify the strength of a trend, as a strong trend is characterized by an increase in volume.
The moving average convergence and divergence indicator (MACD) is another popular technical indicator. The MACD is based on the difference between two moving averages and can help traders identify changes in market direction.
Another useful technical indicator is the stochastic oscillator, which is used to identify the strength of a trend and to identify possible turning points. The stochastic oscillator ranges from 0 to 100, and an asset is considered overbought when the oscillator rises above 80 and oversold when the oscillator falls below 20.
In summary, technical indicators are a valuable tool for traders looking to make informed investment decisions. From the moving average to the stochastic oscillator, there are a variety of technical indicators available to traders. It is important to remember that no technical indicator is infallible and that there is always a degree of uncertainty in any trading operation. Traders should use technical indicators in combination with their own market analysis and experience to make informed trading decisions.


Thank you, friend!


I'm @steem.history, who is steem witness.
Thank you for witnessvoting for me.
please click it!
(Go to https://steemit.com/~witnesses and type fbslo at the bottom of the page)
The weight is reduced because of the lack of Voting Power. If you vote for me as a witness, you can get my little vote.