Top And Worst Asset Performers For The Week Of 3/2/20

Intermarket analysis is a powerful tool that gives traders/investors a macro predictive direction of stocks, bonds, commodities and currencies. Intermarket analysis states that all asset classes are interrelated and that you can’t definitively determine the direction of one asset class without examining the other asset classes.
There are several key relationships that bind these four markets together. These relationships include:
The INVERSE relationship between commodities and bonds.
The INVERSE relationship between bonds and stocks.
The POSITIVE relationship between stocks and commodities.
The INVERSE relationship between the US Dollar and commodities.
The overall goal of the intermarket analysis is to identify top performers or the markets that are outperforming others. With all that said, the top and worst performers from this past week are the following:
Top Performers
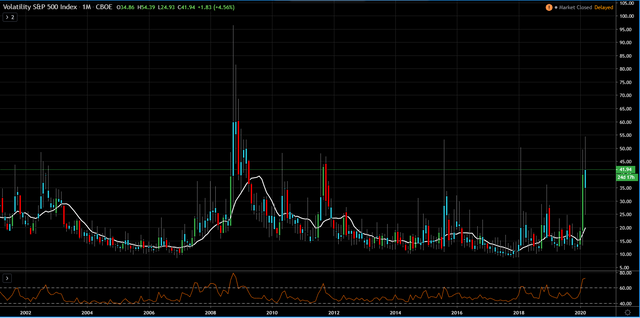
S&P 500 VIX: 31.70%
The VIX measures the volatility over the last 30 days on the S&P 500. Also known, as the fear gauge, VIX values greater than 30 represent risk off trading environments and VIX values less than 20 represent calm Markets.
The VIX index hit a high of nearly 50 in late February. Anything over 50 signifies peak fear and that the bottom is near in the equity markets. However, the VIX remains at levels not seen since 2011 as the bottom in equities might not be in yet. It’s worth noting, the VIX index has hit 50 levels 9 times since 1980s and crossed it only once during the 2008 financial crises.
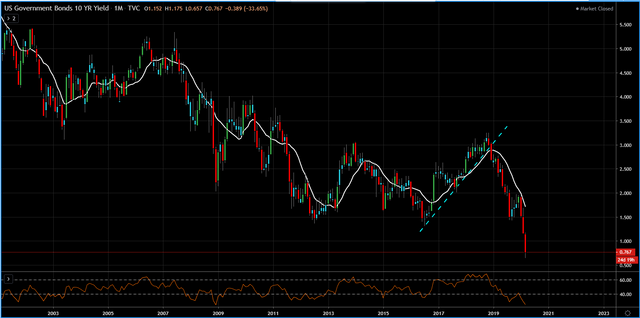
Ultra T-Bond: 8.50%
The Ultra T-Bond 25-Year contract is a Treasury complex contract that us a cash Treasury bonds with at least 25 years of remaining term to maturity. Bonds in general have been on a tear as the global flight to the safety of government debt continued on Friday as evident by the yield on the 10 year not reaching yet another record low today.
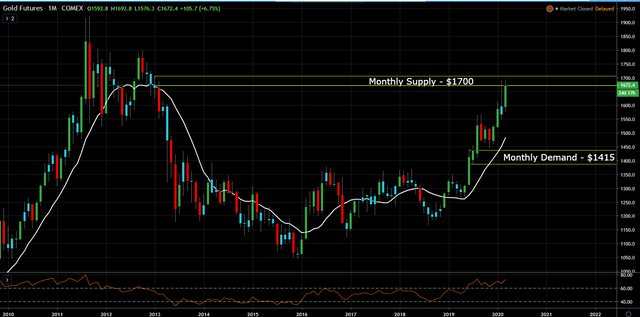
Gold: 6.75%
Gold futures finished higher for the day and week on Friday as investors rotated out of the equity markets and into so called “safe haven” assets. Gold prices are up more than $100 this week, marking the sharpest point and percentage gain over that period since 2011. This marks a huge reversal from last week, when Gold price fell about 5% on Friday, the worst day in seven years due to margin calls.
Worst Performers
Crude Oil Brent: -8.86%
Sugar: - 7.92%
Crude Oil WTI: -7.77%
Oil headed for the biggest plunge since 2015 on signs a global producer alliance that helped engineer crude’s recovery from the worst crash in a generation is unraveling.
Futures plummeted about 9% in New York and London as talks between members of the OPEC+ group collapsed in Vienna. Producers in the alliance are free to pump at will starting next month, after Russia refused to bend to Saudi Arabia’s wish for output cuts aimed at offsetting the coronavirus crisis’s impact on demand.
The end of the talks without a deal raises the prospect of another war for market share among producers, which had exacerbated crude’s collapse back in 2014 amid a global glut.

This post is my personal opinion. I’m not a financial advisor, this isn't financial advise. Do your own research before making investment decisions.

Posted via Steemleo
@rollandthomas Gold futures is doing well for now especially after it had some downtrend move at last week....those who invested on gold futures would be happy to see it performing well..
Posted via Steemleo
Gold's stellar performance should continue this year.
Posted via Steemleo
@tipu curate
Upvoted 👌 (Mana: 0/3 - need recharge?)