An Introduction to ABC Indicator
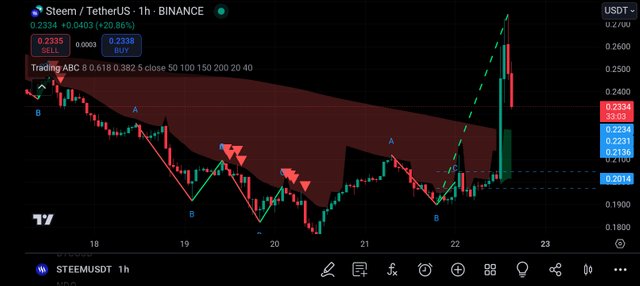
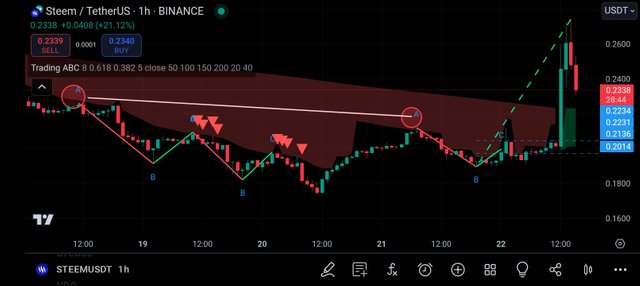
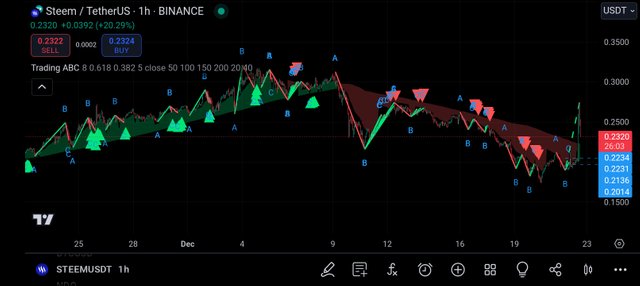
If you have been analyzing the financial markets for a long you might have come across the trading ABC indicator as it is an indicator that has three price movements or better still you can call them waves since they are labeled as A, B, C.

Looking at the above image you will see that the ABC indicator is associated with pattern and as well trend since it is also a technical analysis. If you know the Elliott wave theory very well you will understand that the ABC Indicator looks similar to it. Now let's look into the key features of the indicator.
Key Features
As we have introduced earlier the indicator has three key features which are; A-wave, B-wave, and C-wave.

A-Wave: This is the beginning of a new price movement. You can as well call it the initial movement against the primary trend which you can see in the chart.
B-Wave: This is the wave that separates the two smaller waves (A and C) which are in opposite directions. You can call it the wave that aligns with the main trend which you can see in the chart.
C-Wave: This is the second smaller wave that is in the opposite direction of A. You can also see it as the continuation of a trend.
Many trades see the ABC trading pattern as an impulse pattern since its counter-trend moves just like the way Elliott wave analysis does.
As a trader, you can choose to use the ABC trading indicator in isolation the way it suits you all you have to do while using the ABC Indicator is to identify the following; Pivotal points of waves A, B, and C. You can also use Fibonacci retracement tools to measure the length of the waves which can help you to determine the potential reversal point in the market.
How you can Use ABC Indicator
From all indications, it is very easy to understand and use the ABC Indicator which as a trader all you will have to do is to watch out for the following;

You will need to identify trends and wait for the market (the asset) to form a clear structure of ABC.
The next thing you are to look at for is the retracement level using Fibonacci tools
Finally, you will have to confirm the signals by comparing them with other indicators such as volume, MACD RSI, etc.
You can place a buy order at the end of the C-Wave when the market is in an uptrend, whereas a sell order at the end of the C-Wave when the market is in a downtrend. Finally, your stop loss order can be placed at the extremes of the C-Wave. However, the best thing you can do for yourself as a trader is to understand risk management very well and avoid greed.
https://x.com/AkwajiAfen/status/1870859077418631648
I think I will need to learn about this indicator, it will definitely be great I must confess
Note:- ✅
Regards,
@jueco