Trading Knowledge Day 2 Basic Candlestick patterns
Pic Source - Google
Hello everyone
Hope you are doing good. Let's learn something to increase our financial education knowledge. Today we will learn about OH (Open = High) And OL ( Open = Low)
My most important advice for beginners is use at least 1Hour Time frame chart, don't go below that for at least 6 month.
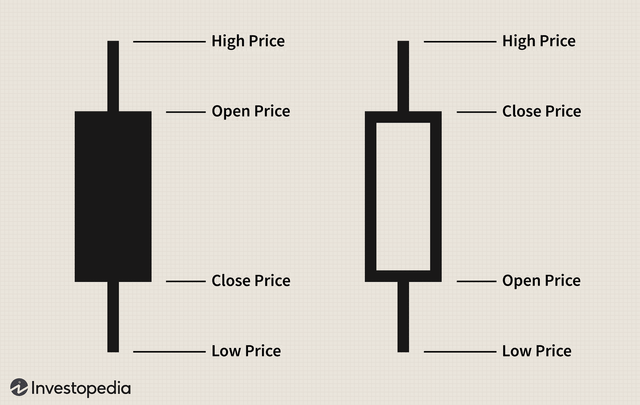
Let's try to learn OL first. As the candle starts forming we just need to check that opening price of candel and lowest price of candel. As soon as we hover the mouse on the candel it will show these prices in top left corner (I am talking about Trading View. It may be different with different brokers). If the opening price of candle and lowest price of candel is same then we can confirm that it is Open = Low.
Now the question is how can we use that OL in our trading. So if we find such thing on any stock or any coin then we have to check few other things also that we will learn in coming days. So have patience and learn first. But one thing I can tell that OL becomes a strong resistence for that day. Price easily will not go below OL. So you can use that as a resistence.
Now lets talk about OH. More or less both are same except a small difference. When open price of the candle and highest price of candle are same means in that candel price is continuously going down after opening of the candel than this is OPEN = HIGH
It will act asa strong resistence for that day. Price will not easily go up from that. Chances are high that as soon as price comes near it. It will drop from there till other support area. We learn more about these concept in depth in coming days. That's all for today.
Happy learning