Top Down Analysis Of ETHUSDT Using Support And Resistance Strategy And RSI Indicator As Confluence

Hello great minds,
It is a great opportunity to come before you all today to share my technical analysis on eth against usdt.
I believe you are all doing perfectly well and are enjoying your activities in the community as you actively promote steemit across various social media platform.
Ethereum is a very big cryptocurrency in the cryptospace and we are well aware of this.
Ethereum happens to be the second most biggest and popular cryptocurrency in the cryptospace.
After Bitcoin which is the driver of all other tokens, ethereum is known to be the next most valuable token, and I am here to share my analysis to it.
ANALYSIS USING SUPPORT AND RESISTANCE STRATEGY
I begin my technical analysis from the higher timeframe, then I descend to the lower timeframe
On the higher timeframe, ideally the monthly timeframe, I seek to determine market trend
The monthly timeframe helps to eliminate market noise from the market and also compress the market to one screen.
And from this, it becomes very easy for the market trend to be predicted.
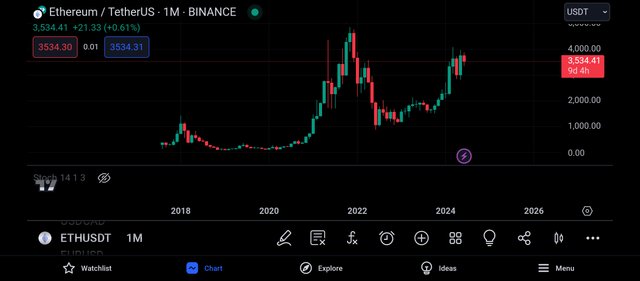
The screenshot above is that of the pair ethusdt on the monthly timeframe.
And as seen above, there are lesser candles on this timeframe and this is as a result of the time it takes for one of this candles to be formed.
On the monthly timeframe, it takes the time period of 1month for each candle to be formed.
And also, it is easy for the overall trend of the market to be detected on this timeframe, as we can see that the market is being bullish.
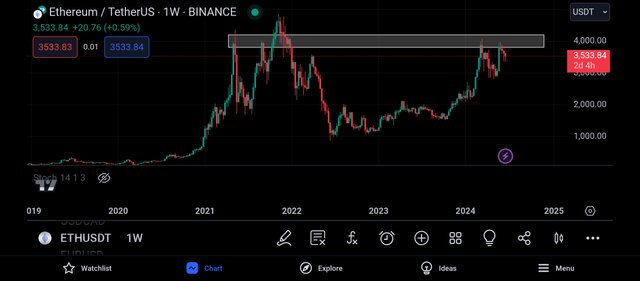
I then continued my analysis on the weekly timeframe, and on this timeframe, it took a trading period of 1week for each candle to be formed.
On this timeframe, I could see more market activities than on the monthly timeframe, and I was able to spot a key level, and this level is functioning as a resistance level to the market price.
On this level, there happens to be more sellers than buyers, and as such, the market is expected to be sold when it trades towards that level.
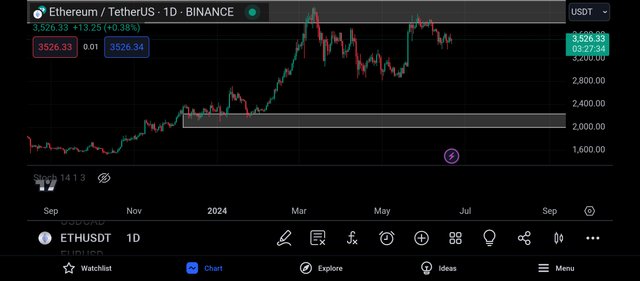
I then continued my analysis on the daily timeframe, and on this timeframe, I could see more candlestick than it were on the weekly timeframe.
And from the above screenshot, I could see that the market has been rejected by the resistance level above just as expected, and it is trading towards the closest support level
What I did next is to identify a support level, a level where the buying pressure is high.
And looking at the price chart very carefully, I was able to spot this level, and it is expected that when the market trades towards this level, it gets rejected to the upside.
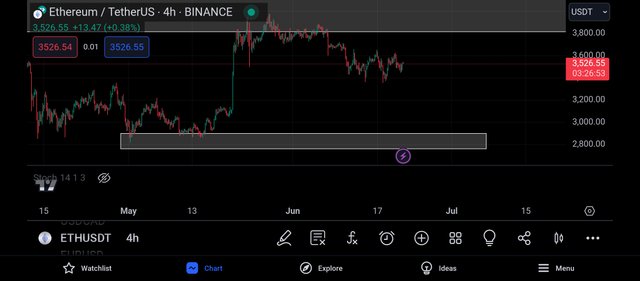
I then decided to continue my analysis on the 4hr timeframe, and on this timeframe, I could see how noisy the market is.
I then Searched for another level in the market, and I was able to spot another support level that is closer to the market price.
And as expected, when the market trades towards this level, we expect to see a bullish rejection.
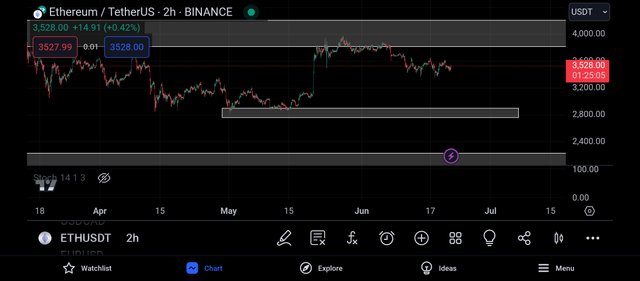
I then moved to the 2hr timeframe in search of entry into the market.
And on this timeframe, I was able to spot another key level, and this level will be functioning as a support level to the market price.
When the market trades towards this level, i expect to see a bullish rejection, and I intend to join the market on this bullish move.
And before then, I decided to search for confluence using the relative strength index indicator
CONFLUENCE USING RELATIVE STRENGTH INDEX INDICATOR
The relative strength index indicator is an indicator that helps to identify overbought and oversold market.
When a market is spotted to be overbought, it is a bearish trend reversal signal and when it is oversold, it is a bullish trend reversal signal.
An overbought market can be spotted when the rsi crosses above the 80% line and an oversold market is detected when the market crosses below the 20% line.
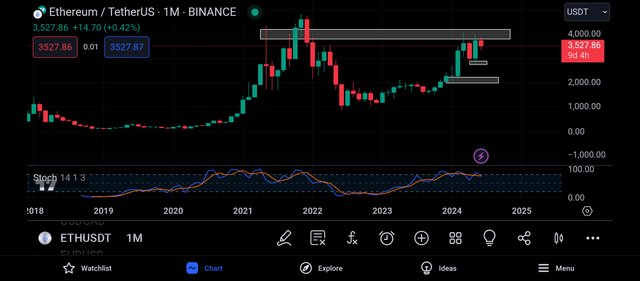
I then decided to add the rsi indicator to the monthly timeframe as I used to do
And on this timeframe, we can see that the market is being overbought as the rsi has crossed above its 80% line.
An overbought market is one that signals a change in market strength from the buyers to the sellers, that is, we expect to see some bearish move in the market.
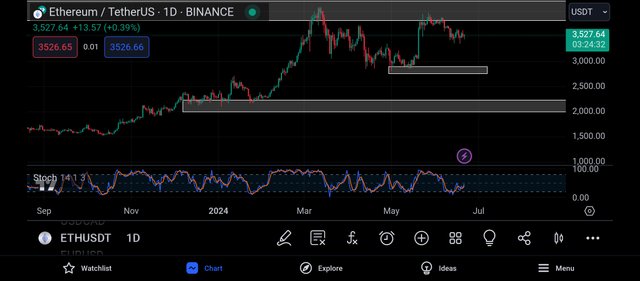
Getting to the daily timeframe, I noticed that the rsi has crossed below its 20% line, and this can be said to be an oversold market.
An oversold market is one that signals a bulllish trend reversal of the market, a change in market character from bearish to bullish.
And this implies that we expect to see a bullish move of the market in a short while.
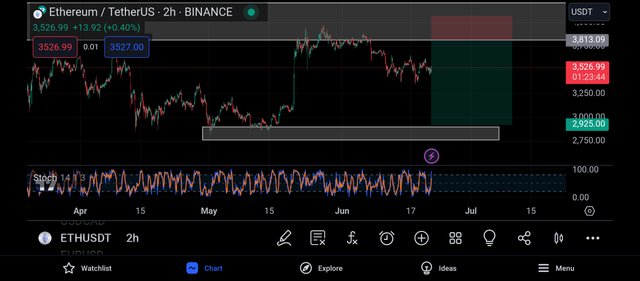
Getting to the 2hr timeframe, I noticed that the rsi has approached it's 80% line, and this can be said to be an overbought market.
And as such, I decided to take a sell order of the market, and I placed my entry on the closest resistance level of the market and my take profit was placed on the market closest support level.
CONCLUSION
I have shared my analysis on ethusdt beginning from the monthly to the weekly to the daily and to the hourly.
From my analysis, I expect to see a bearish move on ethusdt.
https://x.com/JuecoYoung/status/1804272024933773816
Upvoted! Thank you for supporting witness @jswit.