Topdown Analysis Of DYDXUSDT Using Support And Resistance Strategy And RSI Indicator As A Confluence
Hello great minds,
I feel excited to come before you all this evening to relate with you on another interesting post in the community.
I trust you are all doing perfectly fine and are enjoying your activities in the community as you actively promote steemit across various social media platform.
Today I will be sharing my analysis on dydxusdt just as I used to in the community, please stay tuned.
ANALYSIS USING SUPPORT AND RESISTANCE STRATEGY
Dydx is a good token in the cryptospace which is one reason I have chosen it for my analysis today.
And I will be sharing the latest price movement as at when this post was made.
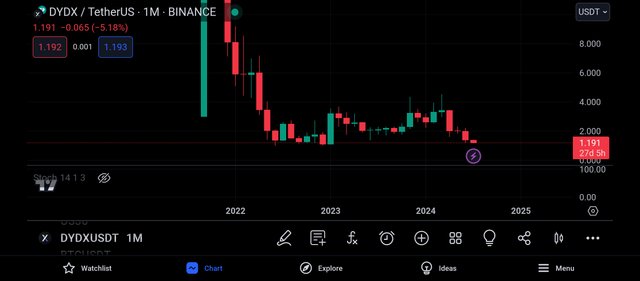
I decided to begin my analysis on the monthly timeframe just as seen above.
And on this timeframe, we can see that there are less candles on the price chart, which indicates the presence of buyers and sellers in the market.
And also, the monthly timeframe helps to filter out noise from the market as each candle is formed within the time period of 1month.
Also on this timeframe, it is very easy for the market overall trend to be detected, and from the screenshot above, we can see that the market is being bearish overall.
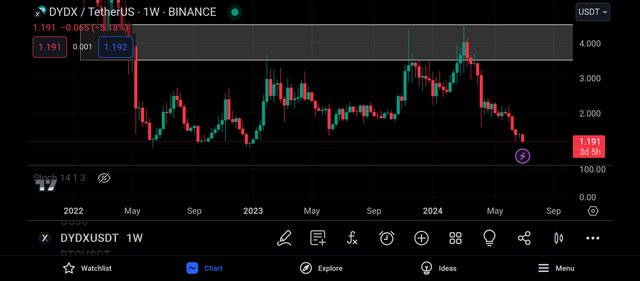
I then continued my analysis on the weekly timeframe, and I noticed that this timeframe has more candlestick than on the monthly timeframe.
And on this timeframe, I was able to spot a key level and this level is functioning as a resistance level to the market, and it is expected that the market will be rejected to the bearish side when it trades towards this level.
On the resistance level, there are more sellers than buyers, and as a result of this, we see bearish movement whenever the market trades towards this level.
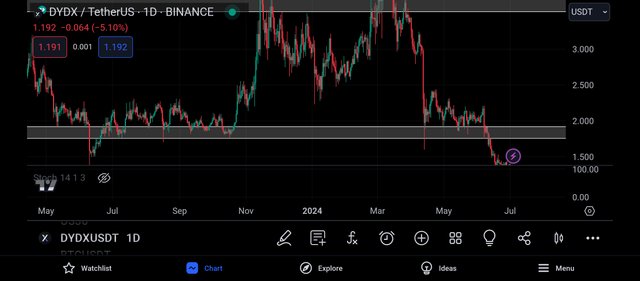
To get more analysis of the market, I decided to move to the daily timeframe.
And on this timeframe, I could see more market activities as there are more candles on this timeframe than on the weekly timeframe.
On this timeframe, I could see the struggle between the buyers and sellers as they try to drive price to their preferred direction.
And on this timeframe, I was able to spot a key level, and this level is known to be a support turn resistance level.
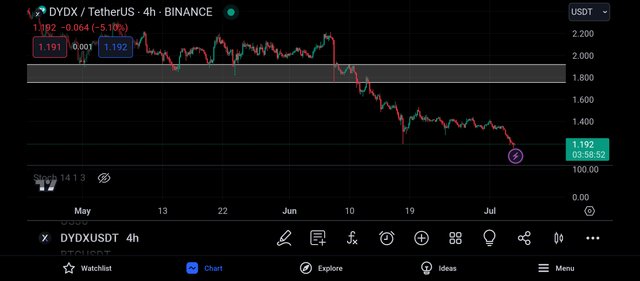
To get more market analysis, I decided to move to the 4hr timeframe.
And on this timeframe I could see how aggressive the sellers are on the market, as the market kept forming lower lows and lower highs.
And from the above screenshot, I can see that the market has aggressively broken below my support level and now this support level will be functioning as a resistance level.
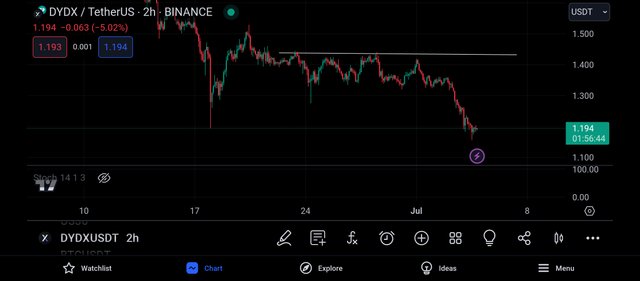
And in continuation to my analysis, I decided to visit the 2hr timeframe, and on this timeframe, I could see the bearish surge in the market.
And looking carefully, I was able to spot a level which will be used as liquidity grab if the market is to continue in its bearish move.
On this level, I can see that the market has made several touches and has been unable to break above, so I expect the market to retrace to this level before continuing on it's bearish move.
And with this I decided to add the rsi indicator as a confluence to my trade.
CONFLUENCE USING RELATIVE STRENGTH INDEX INDICATOR
The rsi Indicator is a very important trading tool in the cryptomarket.
The rsi indicator is used to spot oversold and overbought market regions.
And when a market is spotted to be oversold, it is a signal that the market is about to experience a bullish move.
And when a market is spotted to be overbought, it is a signal that the market is about to experience a bearish move..
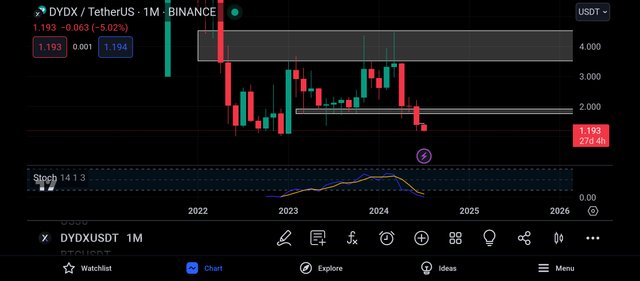
Adding the rsi to the monthly timeframe, I noticed that the rsi has crossed below its 20% line, and this is an indication that the market is being oversold.
An oversold market is one known to give a bullish trend reversal signal, that is, a signal indicating the strengthening of the bulls in the market.
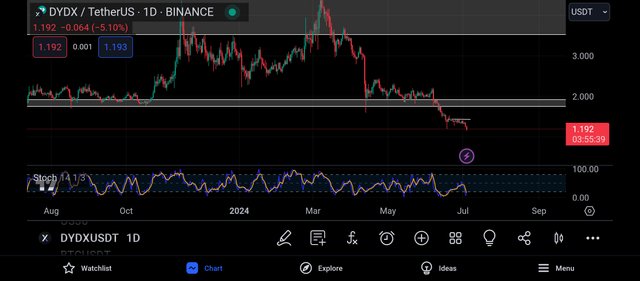
And moving to the daily timeframe, I also noticed that the rsi has crossed below its 20% line.
And this is understood to be a market condition where the bears have become weak in the market and are unable to drive the price any lower.
And as such, the bulls have become strengthened and are ready to push the market upwards.
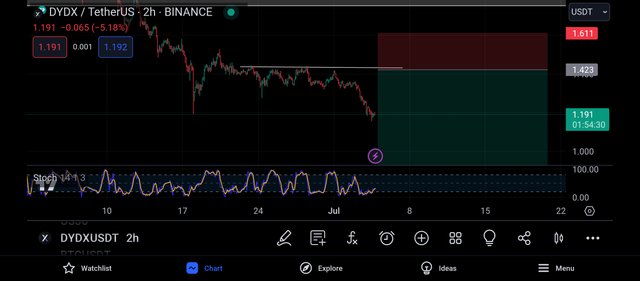
With these analysis, my bias of the market remains bearish, although I expect to see a bullish retracement.
With this, I placed my entry on the closest resistance level to the market and my take profit was placed on the closest support level to the market price.
And this can be confirmed from the above screenshot.
CONCLUSION
Dydx is actually a very good token but before investing in it, I'll advise that you make your personal research about it.
My post was made for educational purpose and not as a financial advice.
https://x.com/JuecoYoung/status/1808979581459742995
Upvoted! Thank you for supporting witness @jswit.