Market Analysis and Investment Strategies
How are you all? Welcome, let's go with a new analysis for the price of bitcoin?

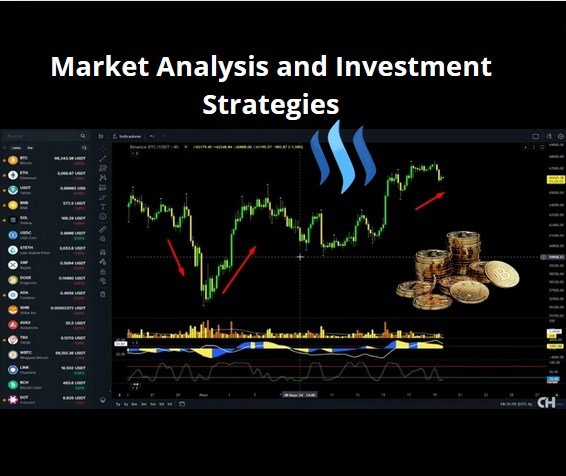
In-depth analysis of the Bitcoin price, addressing key levels.
Key Levels and Bearish Divergence
1 Bitcoin remains around 66,000 without breaking the resistance at 67,000.
2 A possible bearish divergence is identified with a close below $65,800 as confirmation.
3 The bearish divergence has been developing since Friday.
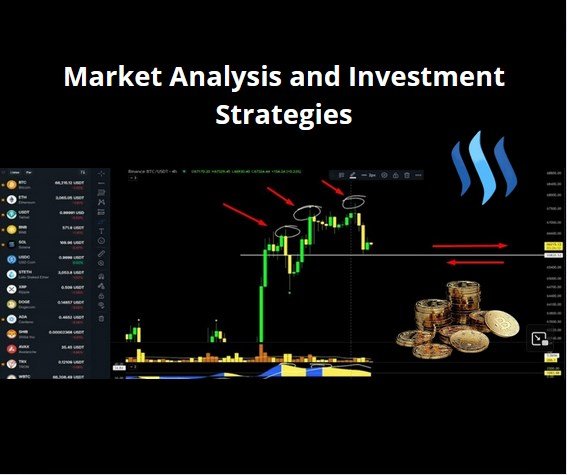
Market Manipulation and Key Areas
A) Market manipulation by whales for liquidations is mentioned.
B) There is a key zone around $65,800 that could indicate significant interest.
Future Scenarios and Possible Movements
1 It is suggested that if Bitcoin does not confirm the bearish divergence, it could approach $69,600.
2 If the bearish divergence is confirmed, the next objective would be around $65,500.
Speculation and Bullish Potential
A) Although there are no confirmations, there is speculation about a possible bullish movement towards $68,000.
Bitcoin Technical Analysis and Outlook
Technical analysis of Bitcoin is set out and discussed and perspectives on possible future price movements are offered.
Technical Analysis and Outlook
1 The current value of Bitcoin could be influenced by external events as well as news in the United States, which could lead to unexpected sharp movements.
2 The possibility of Bitcoin returning to given levels around 7,200-7,900 is raised before attempting to reach $9,500. Word is spreading that these are not definitive investment recommendations.
3 It is suggested to identify optimal buying zones based on price declines, with special attention to specific intervals where to buy during pullbacks.
4 Warns about the disadvantage of looking for buy zones after a sustained price increase, considering it more prudent to wait for opportunities during significant falls.
5 The strategy of buying after sudden price increases is rejected and the importance of seeing falls as opportunities for investment is highlighted.
Price Structure and Resistance
A) Recent price behavior is analyzed on daily and weekly charts, highlighting the price's inability to break key resistances.
B) It warns of possible problems if the price fails to overcome certain resistances within a certain time frame, which could indicate bullish weakness.
C) The importance of candlestick closes to validate real price movements is highlighted as an effective way to confirm trends.
Long-Term Outlook and Investment Decisions
1 If Bitcoin fails to maintain its bullish momentum in the coming hours, there is a realistic possibility of a downward correction without necessarily reaching below $6,000.
2 The need to allow the price to follow its natural course is emphasized without forcing interpretations or hasty decisions based on unfounded expectations.
3 When analyzing weekly candles and the RCI (Relative Strength Index), it is highlighted that these signals should be considered as an integral but not definitive part when making financial decisions.
Final Thoughts on Investment Strategies
A) The importance of understanding the appropriate temporal context for each type of technical analysis is emphasized; Decisions based on weekly charts should be made with caution and a long-term vision.
B) Warn against excessive use of financial leverage when interpreting weekly technical signals; These tools must complement a solid and thoughtful strategy.
Market Analysis and Investment Strategies
Analysis of the financial market and investment strategies, focusing on the interpretation of weekly and daily charts to identify buying and selling opportunities.
Interpretation of the RCI in Weekly Charts
1 The RCI (Relative Strength Index) on a weekly chart indicates that when you are in oversold or overbought zones, optimal opportunities to buy or sell present themselves.
Personal Considerations in Investment Strategies
A) The choice of strategies depends on individual objectives; For example, if the goal is to reach $1,000, it may not matter if the RCI is overbought.
Importance of Custom Analysis
1 The importance of carrying out a personalized analysis to make sound financial decisions is emphasized.
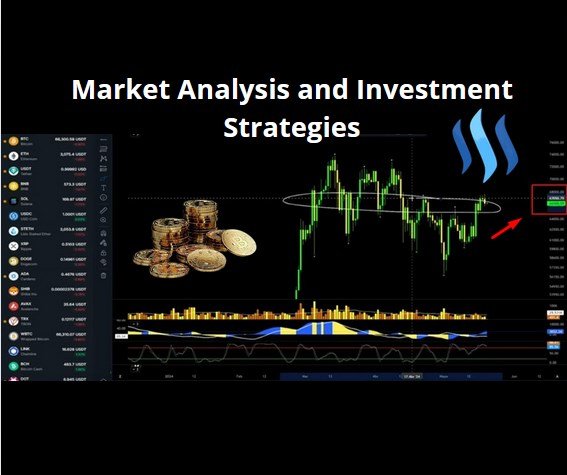
Current Structure of the Financial Market
A) Currently, the market is sideways between approximately 71,500 and 61,000, with no clear confirmations on significant changes in the structure.
Market Phases and Lateralization Concept
1 The bullish, bearish and lateral phases of the market are mentioned. Lateralization represents an oscillation without being either bullish or bearish.
Conclusion
Bitcoin has certain key elements present that affect its evolution. The resistance around $67,500 remains a crucial point to watch, especially considering the possible bearish divergence that has been observed before and after the halving.
| Source of the information: |
|---|
porfavor si lees mi post deja tu comentario .
Weekly count post #2 05/20/2024
Promotion
https://x.com/joel1982jaimes/status/1792601252620038558
Upvoted! Thank you for supporting witness @jswit.
Thank you for supporting witness
Note:- ✅
Regards,
@theentertainer
greetings