Learn About Time Interval, High Volumes, Accumulation & Distribution || by @faran-nabeel
Hello Friends, How are you? Let's start with a beautiful day, I hope your day was a good and you all enjoyed your day. I sm also well and enjoying my day with my different engagements. Now i am going to ake my new article on steemit blog and today iwill be disscus about my new crypto lesson. I hope you really miss my lessons in steem alliance community.
Today am here in Alliance community because from my padt frw days i was bit busy with my personal works i can't write my new lessons on crypto, but today am going to discuss about the time interval in Crypto Chart and i will also disscus about the volumes. I will be disscus about accumulation and distribution in crypto Chart. I hope it will be helpful for my friends and members .
Time Interval & High Volume, Accumulation ,& Distribution
Time interval is simply the period of time represented by a single unit on the chart. For the Candlestick chart, the amount of time it takes for a single candle unit to form is determined by the time interval chosen. For example, a 5-minutes time interval would mean that each candle contains 5-minutes of data. An hourly time interval produces candles on an hourly basis while a daily time interval produces candles on a daily basis.
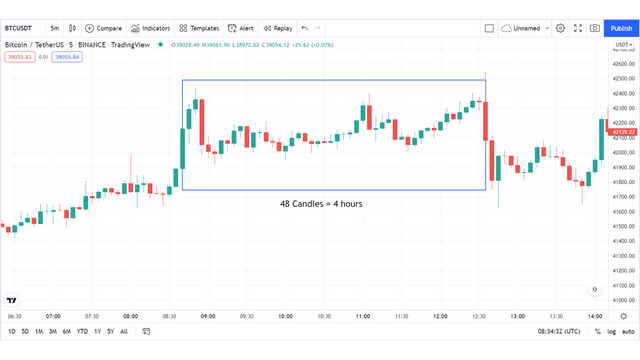
The candlestick chart above has a 5-minutes time interval. Each candle represents 5 minutes of data and so takes 5 minutes to form. The range highlighted contains 48 candles. Since these candles are 5 minutes each, 48 of them would make up 4 hours of data.
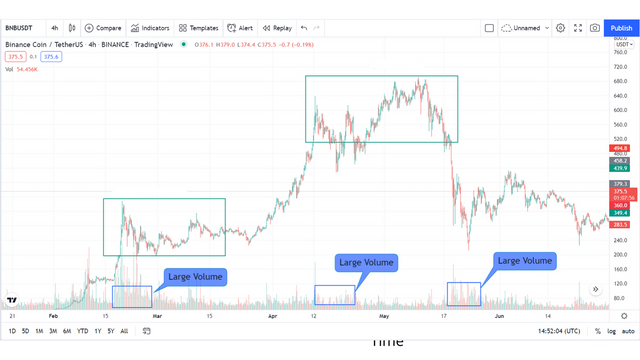
Volume is an important factor to consider when trading because it is the measure of how much money is flowing into or out of a market. This volume factor is very crucial when identifying Accumulation and Distribution phases in the market.
Strong hands in the markets are always at play. During the Accumulation phase, large institutions or whales slowly and gradually buy and asset. By doing this, they pump money into the asset and this can be seen as spikes on the volume indicator.
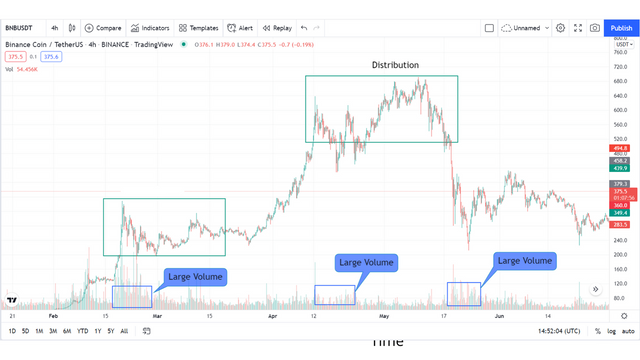
Similarly, during the distribution phase, the large institutions have made their profit and begin to slowly sell their assets. When they finish, the demand reduces and the price starts to fall. Due to the fact that these large players take out a lot of money from the asset, we see an increase in volume in this phase as well.
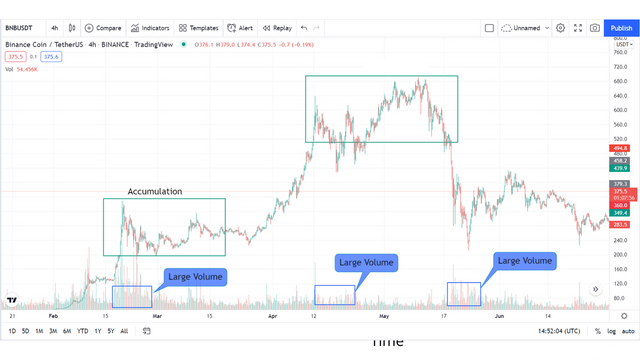
Conclusion
In the image above, we can see that large player gradually accumulated the asset as confirmed by the volume. After they had made their profits, the started to sell the asset gradually and in the end, the price fell back.
Cc, @stephenkendal | rme | steemcurator01 Best Regards to, Faran Nabeel


 |
|---|
https://steemlogin.com/sign/account-witness-vote?witness=stmpak.wit&approve=1
OR
https://steemitwallet.com/~witnesses

Just Write stmpak.wit & Vote 🙂
Social X Promotion 🎉
https://twitter.com/FaranNabeel/status/1726988248625631689?t=qVMpSoYfp0bnABVj4Vw-3w&s=19
Upvoted! Thank you for supporting witness @jswit.
Dear @faran-nabeel ,
We appreciate your active participation and contributions to our community. To ensure a positive environment for all members, we have implemented a set of guidelines to maintain respectful and constructive discussions while upholding community guidelines.
Keep sharing quality post in the community
Now Engage, Connect, and Inspire Each Other to Reach New heights.
Thank You.
Thanks brother