Effective Strategy to Identify Breakouts & Rebounds || By @faran-nabeel

Hello Friends, How are you? I hope all lf my friends and all the members are fine. I am aslo happy and fine and enjoying my time with steem alliance community. Now am again back to this community for increasing my contribution with my crypto lessons and showing my commitment with this community. Today am going to write my new crypto lesson on steem alliance community.
Today am here to write about a effective way to find crypto breakouts and rebounds in crypto trading charts. You know thet when the price of an asset or crypto coins meets a support or resistance level, either the rebound occurs or a breakouts occurs. I will explain these in this post and educate you about this strategy. Ao, let's without wasting our time.
Effective Way to Find Breakouts & Rebounds in Crypto Chart
My dear friend in this my post we are going to fuss about the very effective strategy of crypto trading and for our technical analysis, in which we will be disscus about;
- Breakouts
- False Breakouts
- Rebounds
Today we covered these mentioned points of crypto chart in this post. Here lets start from crypto breakouts.
Breakouts In Chart
A breakout occurs when the price of an asset gets to a resistance or support level and breaks through it. In this case, the support or resistance level does not reject the price rather the price closes below or above these levels. A breakout is associated with considerably higher volumes. When the breakout happens with enough momentum.
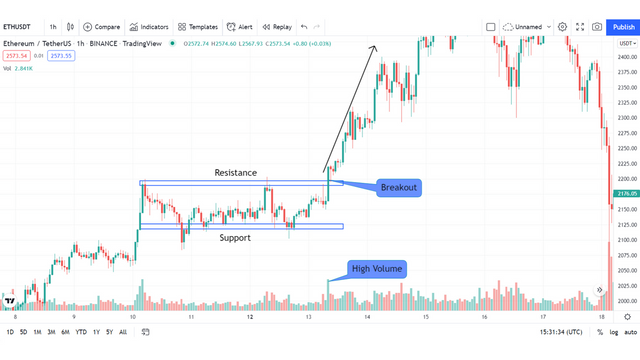
It is confirmed that the market would continue in that direction and then the broken resistance level becomes a support level and vice versa. In the image above, we can see that the price had broken through the resistance and closed above it. There was enough momentum and so the trend continued causing the resistance to become a support level.
False Breakouts In Chart
A false breakout is simply a presumed breakout situation that fails in the end. It happens when the price of an asset closes above a resistance or below a support and returns to the range it previously was. This trading trap happens when there is not enough momentum for the trend to continue. Because of this, the pre-existing buying pressure at support or selling pressure at resistance acts on the price and pushes it back in the range.
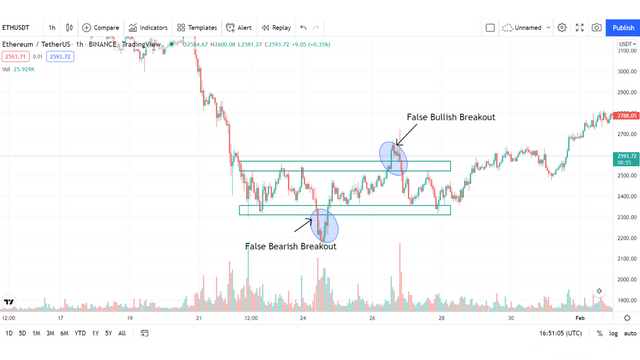
In the image above, we can see the point where the price of the asset closed above the resistance for a presumed breakout but returned back to the previous range. That situation is a false bullish breakout. The situation of a false bearish breakout is also given in the image.
Rebounds In Crypto
A rebound is a situation when the price of an asset gets to a resistance or support level and reverses its direction due to high selling or buying pressure at these zones. These rebounds are what make us aware of these zones to begin with. At resistance zones, the price of an asset would pause during its upward movement and reverse downward.
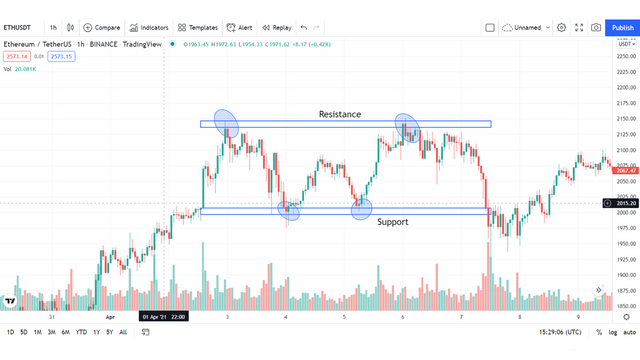
At support levels, the price would pause during its downward movement and reverse upward. In the image above, we can see how the price of the asset got rejected at the support and resistance levels and got rebounded. Here on this section you can learn and know about the rebounds in crypto trading and how we can check this situation during our analysis.
Conclusion
In this post i mentioned a very effective strategy to find breakouts and rebounds situation in charts. Through this information you xan practice to find crypto breakouts ans you besy entry points on chart This is a effective way of trading and technical analysis. You can practice on your lwn behalf.
Cc, @stephenkendal | rme | steemcurator01 Best Regards to, Faran Nabeel


 |
|---|
https://steemlogin.com/sign/account-witness-vote?witness=stmpak.wit&approve=1
OR
https://steemitwallet.com/~witnesses
Just Write stmpak.wit & Vote 🙂
Social X Promotion,
This post has been supported through the account Steemcurator06 for containing good quality content.
Curated by : @sduttaskitchen
Thanks 😊
This is an interesting breakouts and rebound strategy you have shared.
It would be more interesting if you showed us a practical application of it.