Steemit Learning Challenge Season 21 Week 2 - The Statistics
Week 2 : The Background …
Season 21 sees the rebranding of Steemit Engagement Challenge and is now Steemit Learning Challenge (SLC). The teaching team for season 21 was announced by @steemitblog on October 25 through this article. In season 21, there was an increase in the number of classes, although there were classes in the previous season that did not continue in this season. The total number of classes in season 21 is 17, an increase of 1 compared to the previous season's 16.
Week two of the Season 21 started on November 4th, and was announced by @steemitblog via announcement article.
The seventeen classes in the second week of season 21 can be seen in the following list. Note: The table consists of 5 columns, if you are accessing via mobile phone, you may need to set your browser to desktop mode to see it in full.
The Statistics of Week 2
First table shows the number of entries each class and their recorded scores.
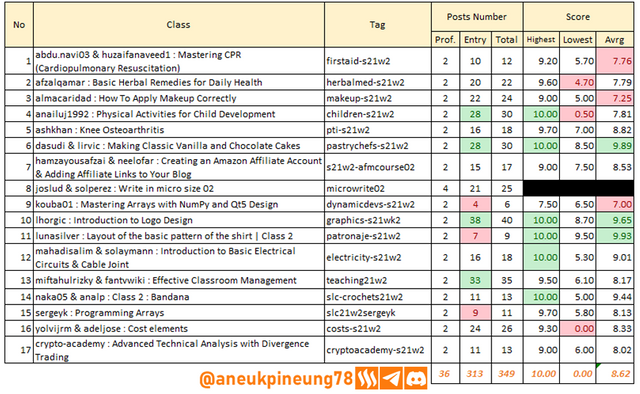
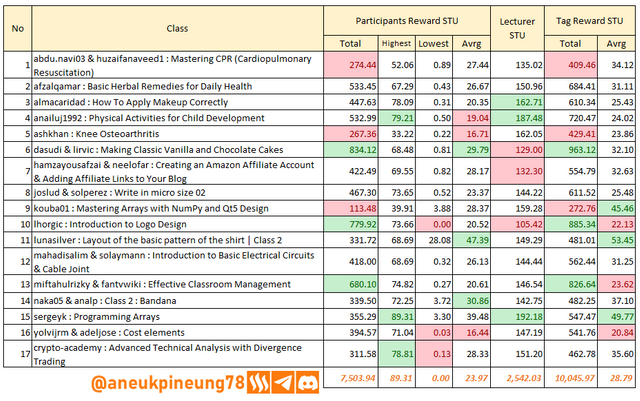
Table 2 is the rewards table, showing the number of rewards collected by participants and lecturers and the total amount for each class. Tag Reward = Total Participants Reward + Total Lecturers Reward. The red and green fills in each column indicate the bottom three and the top three, respectively.
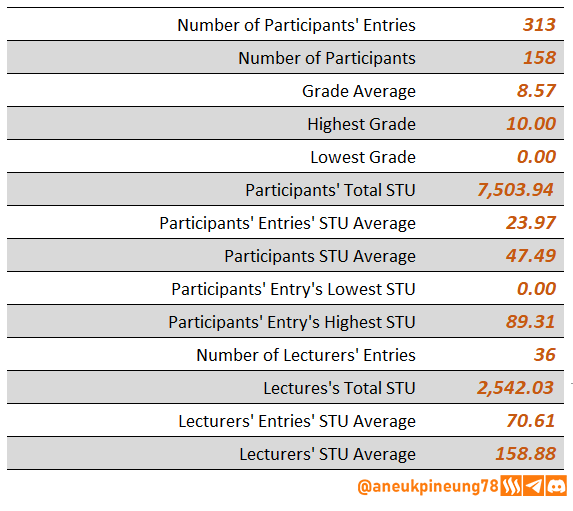
Third table brings us the comprehensive information from the above two tables in a simple informative form.
From the data above, 8 charts were generated.
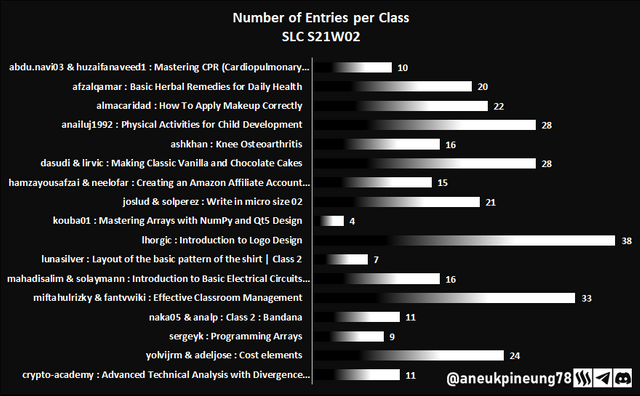
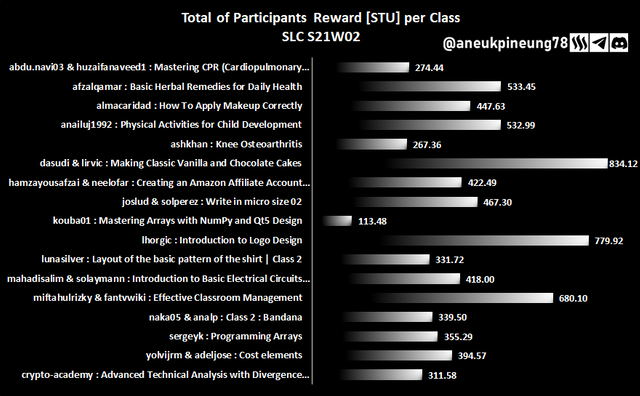
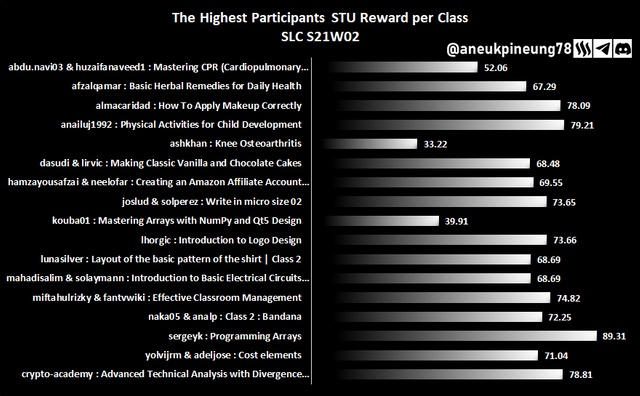
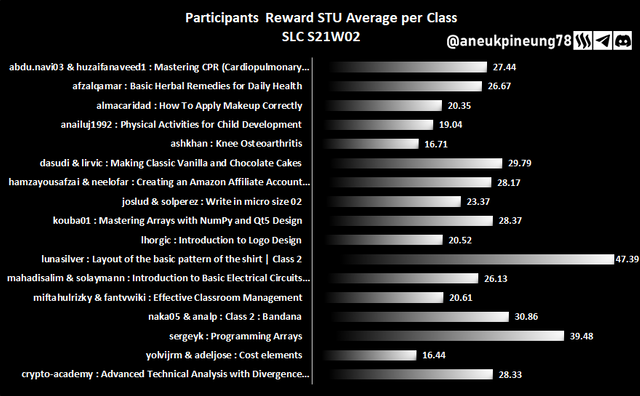
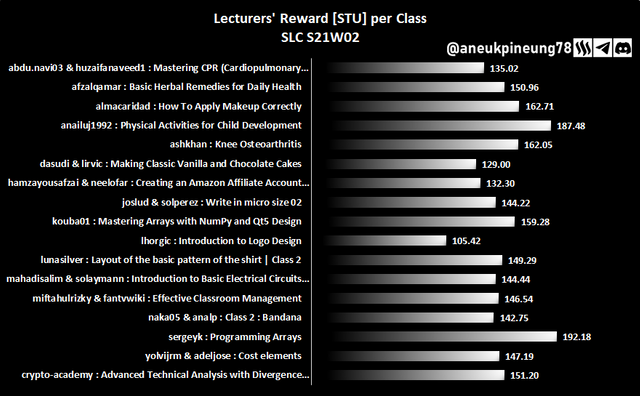
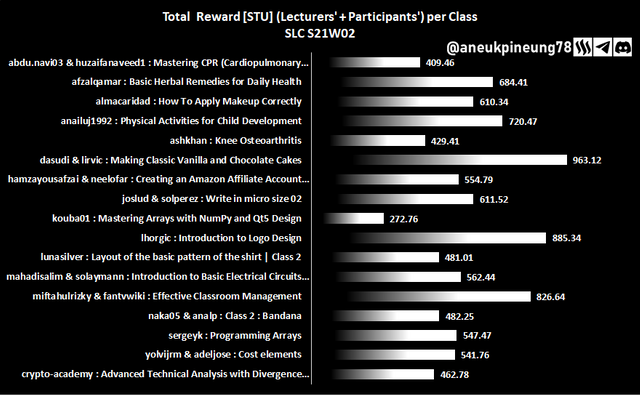
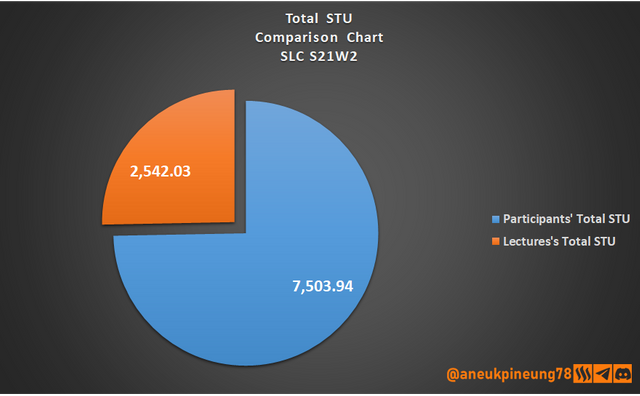
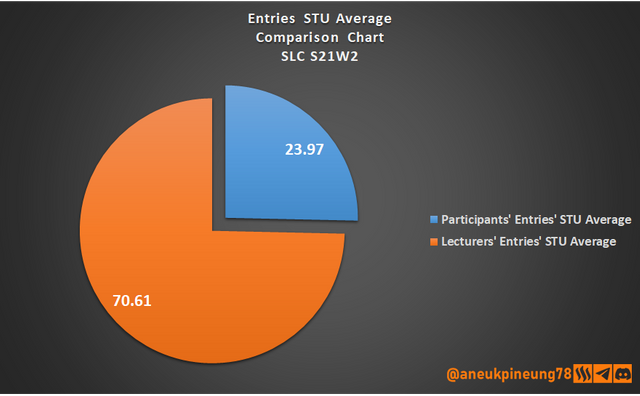
The following table shows the list of the 20 most active participants (based on the number of challenge entries) in the first week of season 20. It is shown along with the number of rewards (STU) they collected and the average reward (STU) per article. The amount shown is from contest participation, if there are lecturers on the list, then the number does not include the rewards they get as a lecturer.
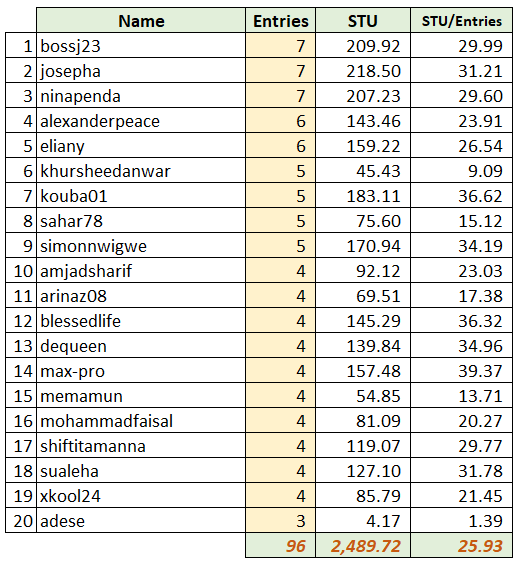
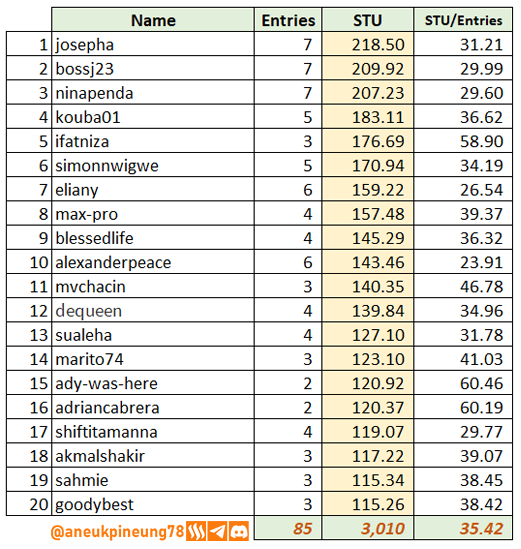
The table below lists 20 Steemians with the highest reward collected in the week 1 of season 21. Again, the amount shown here is from contest participation, if there are lecturers on the list, then the number does not include the rewards they get as a lecturer.
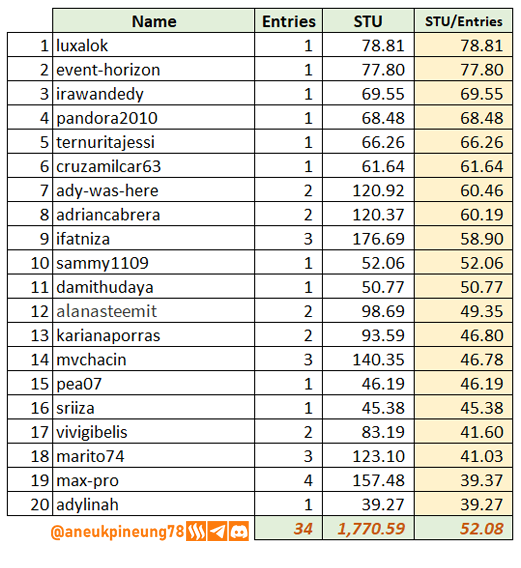
The next table shows the top 20 participants that recorded the highest STU average per entry.
The table below shows the reward (STU) collected by lecturers in each course, ranked alphabertically.
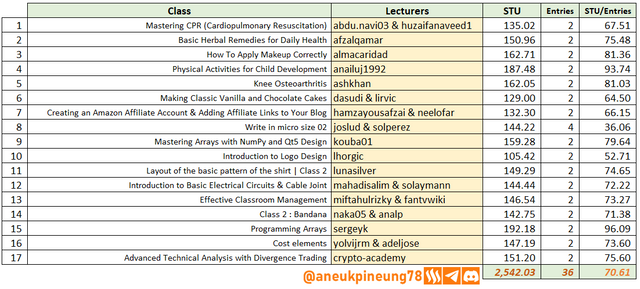
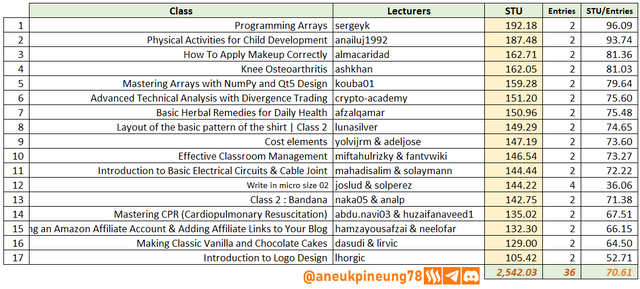
Below is the table that shows the ranking by the highest to lowest in term of total STU collected by each lectuter, along with the number of entries and the average per entry.
That’s all! And, this was another great week! I’ll be back for week 3.
See the previous week(s) report here: Week 1.
And, very much thanks for your support, steemcurator01, @steemcurator02, and all another 7 SCs who happens to reach this post. Much Love.

Telegram | Discord
Terimakasih.


on x https://x.com/aneukpineung78/status/1860923810805166439

Thanks for you meticulous work
You yourself has done great job on the blockchain.
Thanks.