Log Charts
In cryptocurrency trading, log charts can indeed be more reliable than linear charts in certain contexts, particularly when analyzing long-term trends or data that spans a wide range of prices.
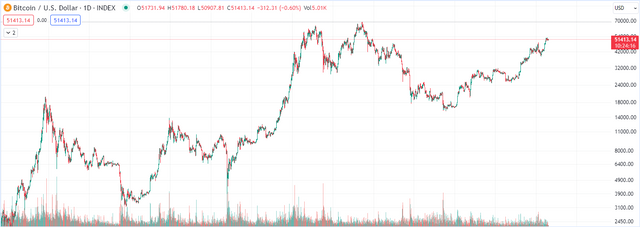
Log Chart of BTC
Why Log Charts Can Be More Reliable
Percentage Changes**: Log charts represent price scales in percentage terms rather than absolute dollar terms. This is crucial for understanding the relative impact of movements across different price levels. For example, a move from $1 to $2 is a 100% increase, just as a move from $100 to $200 is. A log chart visually represents these equal percentage changes equally, whereas a linear chart would not.
Long-term Trends**: For assets that have experienced exponential growth, such as many cryptocurrencies, log charts can make it easier to identify the underlying trend. Linear charts can sometimes exaggerate recent movements, making it harder to see the long-term trend.
Volatility**: Log charts can help in visualizing the volatility and relative price movements over time more clearly than linear charts, especially over long periods.
When to Use a Log Chart
Long-Term Analysis: When you're looking at the performance of a cryptocurrency over several years, a log chart can help you see the trend without recent price spikes or drops overshadowing earlier movements.
Comparing Assets: If you're comparing the performance of two or more assets that have different price ranges, log charts can provide a fair comparison by focusing on percentage changes rather than absolute price changes.
High Volatility Assets: Cryptocurrencies are known for their high volatility. Log charts can provide a clearer picture of an asset's growth pattern and volatility over time.
When to Use a Linear Chart
Short-Term Analysis: For short-term trading or when analyzing price movements within a narrow price range, a linear chart might be more useful. It provides a direct view of price changes and is more intuitive for understanding short-term price actions.
Specific Price Levels: When you're interested in specific price levels, such as support and resistance levels within a short timeframe, a linear chart might be more straightforward.
The choice between a log chart and a linear chart in crypto trading depends on the context of your analysis.
Log charts are particularly useful for long-term trend analysis and when dealing with assets that have undergone significant price changes.
Linear charts, on the other hand, might be more suitable for short-term analysis and when working with narrow price ranges. It is required to consider your analytical goals and the specific characteristics of the data you're working with when choosing between these chart types.
Harry Potter Library (HPL) Community
Please join the HPL community. You will get upvotes for your posts. Simply join and post there using the tags "hpl" or "harrypotterlibrary" in your post.
- Community Address: https://steemit.com/trending/hive-140602
- About HPL Community:
EN: Harry Potter Library - HPL
KR: [해리포터의 도서관 (Harry Potter Library, HPL)](https://steemit.com/hive-140602/@harryji/ab7uv-harry-potter-library-hpl
This post was upvoted by @upex upvoting Services with 0.90%. To learn more Join our Discord community here.

This post was upvoted by @upex upvoting Services with 0.90%. To learn more Join our Discord community here.

This post was upvoted by @upex upvoting Services with 0.90%. To learn more Join our Discord community here.

This post was upvoted by @upex upvoting Services with 0.90%. To learn more Join our Discord community here.

This post was upvoted by @upex upvoting Services with 0.90%. To learn more Join our Discord community here.

This post was upvoted by @upex upvoting Services with 0.90%. To learn more Join our Discord community here.

This post was upvoted by @upex upvoting Services with 0.90%. To learn more Join our Discord community here.
