Riding the Bitcoin Waves

We shot up 7 days ago around the time that the 10 and 40 day moving averages crossed. That was a great indicator and we always keep an eye on those MAs but like to watch the 50 for more sustained moves. If you're a day trader and like to ride the waves you have to watch the shorter indicators too!
Right now BTC is sitting nicely in the upper band of the Bollinger bands. The bands have grown and we're no longer looking over bought which is good. Also, the gap in the 10 and 50 day moving averages has grown a bit over the last few days.
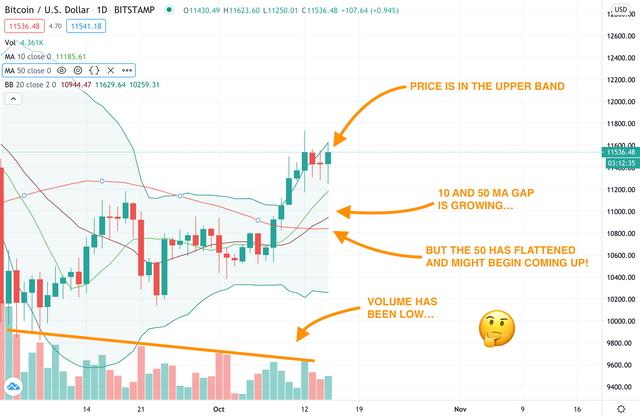
On the other hand, we're noticing that the 50 day moving average has flattened off and it will likely begin to come up soon. The 40 day MA is already moving up... So, if we're in a bull trend, the price should move up with it... but if we're not it might catch us and cross the 10 day MA which would indicate a sell moment.
Riding those waves! 🌊
Also worth noting is that the volume seems to be trending down over the past month. This isn't necessarily bad, but can be an indicator of things to come and where the trend in BTC movement is going. Typically, when we see volume drop for a month or so it's followed by some action!
Keep watching the charts! 📈
Please note : this is opinion and should not be taken as financial advice.