IS IT OPEN? Global Market Status at-a-Glance with Python

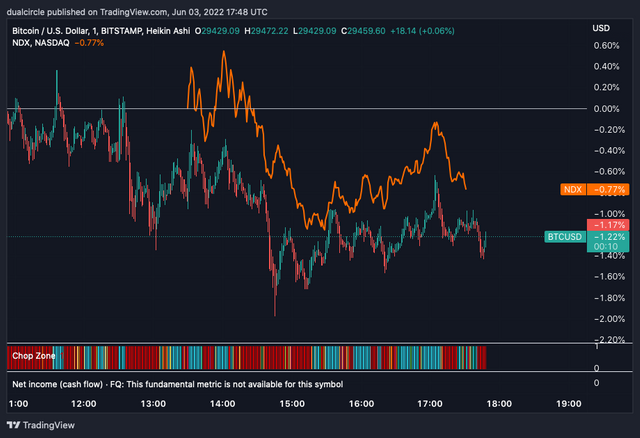
The price of Bitcoin tends to correlate with stock market indices, so the market hours of stock exchanges should be factored into some trading strategies. IS IT OPEN? is obviously an important question in that arena.
Below: NASDAQ 100 and BTC in a tight correlation on Friday, June 3rd 2022. Image captured by author.

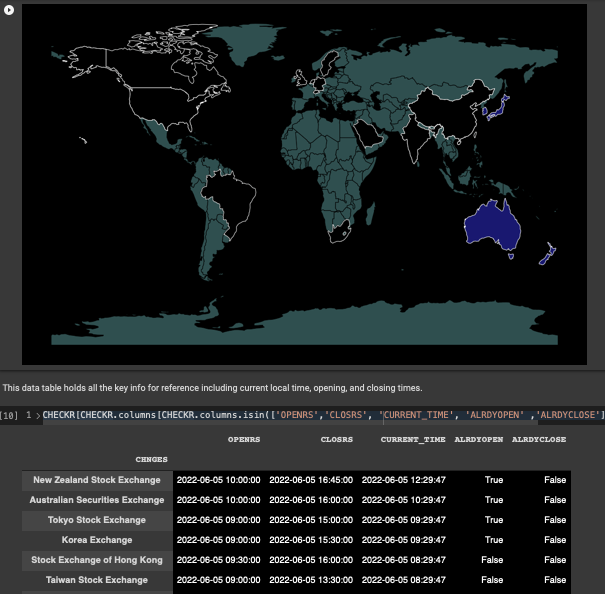
This post shares a Python tool I've been working on. I use it to consolidate and display the open/closed statuses of several large stock exchanges. I find it useful reference when I'm trading.
Below: Example output of tool. Blue-filled states represent open-status of stock markets in or near state. Image captured by author.

I hope at least a few people here on Steemit find this tool useful. Please let me know what you think, and thanks in advance.
Introduction
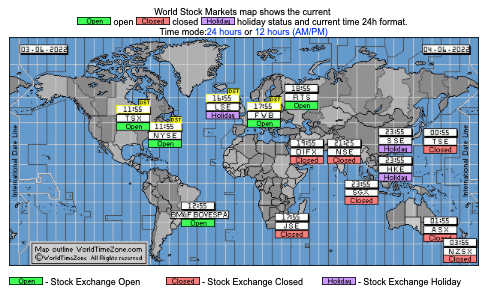
I've used the World Stock Markets map on worldtimezone.com for years to get a consolidated view of global market statuses. Lately though, I've wanted a more intuitive view of this information, so I decided to build a similar tool for my own use.
Below you'll find my Python code, pertinent links, and instructions for how to build it.
Below: World Stock Markets map on worldtimezone.com, my long-time resource for global market statuses at-a-glance. Image captured by author Friday, June 3rd 2022.

Description & Prospectus
This tool delivers the same services as the World Stock Markets map. That is, a map with data tables detailing major global markets’ open/closed hours and statuses. I find my tool a little more intuitive to read at-a-glance than www.worldtimezone.com (and easier on the eyes), even now in its rough, unfinished state.
UNFINISHED
It is unfinished in that I still need to add the data for market holiday closures, which will take a little bit of effort for sure. I also intend to add data for some additional markets such as Singapore and Israel. Further down the line I would also like to visually integrate pre-post trading hours into the system for all applicable exchanges, and maybe, maybe put labels on the map - although I like how clean it looks as an unlabelled, binary qualitative progression choropleth map
Since everything below is just Python code at this point, you can simply copy it and use it for your own purposes. If you carry the work forward in the same direction as above, maybe we could collaborate on the project? Let me know.
DISCLAIMER
Please note that like all tools of this kind, constant maintenance will be required in order for the data presented to stay up to date and accurate.
Methods
Written in Google Colab's free-tiered Jupyter Notebook. See the complete public notebook in Colab and on my Github.
CODE
Begin by installing and importing packages as applicable.
!pip install geopandas
import geopandas as gpd
import matplotlib.pyplot as plt
plt.style.use('dark_background')
import datetime
from datetime import datetime
import pytz
import pandas as pd

utcmoment_naive = datetime.utcnow()
utcmoment = utcmoment_naive.replace(tzinfo=pytz.utc)
List the exchanges, their timezones, and their open/close hours. You might notice, lunch hours are included in own list, these will be integrated into the system at a later date, currently WIP.
These data are pulled from a variety of sources, most often trading hours.com. If this tool ever really developed I'd want to pull the info right from the exchanges websites, as I've done for the NZX exchange.
T_ZNES = ['Asia/Seoul',
 'Asia/Tokyo',
 'Asia/Hong_Kong',
 'Asia/Kolkata',
 'Asia/Kolkata',
 'Europe/Zurich',
 'Europe/Zurich',
 'Europe/Zurich',
 'Europe/Zurich',
 'Africa/Johannesburg',
 'Europe/London',
 'Australia/Sydney',
 'America/Argentina/Buenos_Aires',
 'America/New_York',
 'America/New_York',
 'America/Toronto',
 'Asia/Riyadh',
 'Asia/Shanghai',
 'Asia/Shanghai',
 'Asia/Shanghai',
 'Pacific/Auckland']


GLOBAL_XCHNGS=['Korea Exchange',
'Tokyo Stock Exchange',
'Stock Exchange of Hong Kong',
'National Stock Exchange of India',
'BSE Limited',
'Frankfurt Stock Exchange',
'SIX Swiss Exchange',
'Euronext Amsterdam',
'Nasdaq Stockholm AB',
'Johannesburg Stock Exchange',
'London Stock Exchange',
'Australian Securities Exchange',
'B3 S.A.',
'New York Stock Exchange',
'Nasdaq Stock Market',
'Toronto Stock Exchange',
'Saudi Stock Exchange',
'Shanghai Stock Exchange',
'Shenzhen Stock Exchange',
'Taiwan Stock Exchange',
'New Zealand Stock Exchange']

OPENS=['9:00:00',
'9:00:00',
'9:30:00',
'9:15:00',
'9:15:00',
'9:00:00',
'9:00:00',
'9:00:00',
'9:00:00',
'9:00:00',
'8:00:00',
'10:00:00',
'10:00:00',
'9:30:00',
'9:30:00',
'9:30:00',
'10:00:00',
'9:30:00',
'9:30:00',
'9:00:00',
'10:00:00']


CLOSES_OR_TAKES_LUNCH = ['15:30:00',
 '11:30:00',
 '12:00:00',
 '15:30:00',
 '15:30:00',
 '17:30:00',
 '17:20:00',
 '17:30:00',
 '17:25:00',
 '17:00:00',
 '12:00:00',
 '16:00:00',
 '17:55:00',
 '16:00:00',
 '16:00:00',
 '16:00:00',
 '15:00:00',
 '11:30:00',
 '11:30:00',
 '13:30:00',
 '16:45:00']

REOPEN_AFTER_LUNCH=['9:00:00',
'12:30:00',
'13:00:00',
'9:15:00',
'9:15:00',
'9:00:00',
'9:00:00',
'9:00:00',
'9:00:00',
'9:00:00',
'12:02:00',
'10:00:00',
'10:00:00',
'9:30:00',
'9:30:00',
'9:30:00',
'10:00:00',
'13:00:00',
'13:00:00',
'9:00:00',
'10:00:00']

TRUE_CLOSING_TIME = ['15:30:00',
 '15:00:00',
 '16:00:00',
 '15:30:00',
 '15:30:00',
 '17:30:00',
 '17:20:00',
 '17:30:00',
 '17:25:00',
 '17:00:00',
 '16:30:00',
 '16:00:00',
 '17:55:00',
 '16:00:00',
 '16:00:00',
 '16:00:00',
 '15:00:00',
 '15:00:00',
 '14:57:00',
 '13:30:00',
 '16:45:00']
Create formatting for datetimes
# Format of local time

LOCAL_TIME_FORMAT = "%Y-%m-%d %H:%M:%S"

# Format of local time without date info

LOCAL_TIME_FORMAT_NO_DATE = "%H:%M:%S"
Combines local times accessed with the pytz package and then combine all the info into a table, seperate out some datetime elements for use momentarily.
"""# OPEN CLOSE 1"""

FIRST_OPEN=pd.to_datetime(pd.Series(OPENS), format="%H:%M:%S")
FIRST_OPEN=FIRST_OPEN.dt.strftime("%H:%M:%S")


FIRST_CLOSE_OR_LUNCH=pd.to_datetime(pd.Series(CLOSES_OR_TAKES_LUNCH), format="%H:%M:%S")
FIRST_CLOSE_OR_LUNCH=FIRST_CLOSE_OR_LUNCH.dt.strftime("%H:%M:%S")


"""# OPEN CLOSE 2"""

SECOND_OPEN_POST_LUNCH=pd.to_datetime(pd.Series(REOPEN_AFTER_LUNCH), format="%H:%M:%S")
SECOND_OPEN_POST_LUNCH=SECOND_OPEN_POST_LUNCH.dt.strftime("%H:%M:%S")


FINAL_CLOSING_TIME=pd.to_datetime(pd.Series(TRUE_CLOSING_TIME), format="%H:%M:%S")
FINAL_CLOSING_TIME=FINAL_CLOSING_TIME.dt.strftime("%H:%M:%S")

"""# LOCAL TIMES WITH DATE"""

TIMELIST_0=['LOCAL_TIME_WITH_DATE']

import pandas as pd
for tz in T_ZNES:
    localDatetime = utcmoment.astimezone(pytz.timezone(tz))
    TIMELIST_0.append(str(localDatetime.strftime(LOCAL_TIME_FORMAT)))
    #print(localDatetime.strftime(LOCAL_TIME_FORMAT))
LOCAL_TIMES_WITH_DATE=pd.DataFrame(TIMELIST_0)[1:].reset_index()
LOCAL_TIMES_WITH_DATE['LOCAL_TIME_WITH_DATE']=LOCAL_TIMES_WITH_DATE[0]

LOCAL_TIMES_WITH_DATE

"""# LOCAL TIMES WITHOUT DATE"""

TIMELIST_1=['LOCAL_TIME_WITHOUT_DATE']

import pandas as pd
for tz in T_ZNES:
    localDatetime = utcmoment.astimezone(pytz.timezone(tz))
    TIMELIST_1.append(str(localDatetime.strftime(LOCAL_TIME_FORMAT_NO_DATE)))
    #print(localDatetime.strftime(LOCAL_TIME_FORMAT))
LOCAL_TIMES_WITHOUT_DATE=pd.DataFrame(TIMELIST_1)[1:].reset_index()
LOCAL_TIMES_WITHOUT_DATE['LOCAL_TIME_WITHOUT_DATE']=LOCAL_TIMES_WITHOUT_DATE[0]

LOCAL_TIMES_WITHOUT_DATE

"""# EXGLOBAL_XCHNGS TO DF"""

LOCAL_TIMES_WITH_DATE['LOCAL_TIME_WITHOUT_DATE']=LOCAL_TIMES_WITHOUT_DATE['LOCAL_TIME_WITHOUT_DATE']
GLOBAL_XCHNGS=pd.Series(GLOBAL_XCHNGS)
GLOBAL_XCHNGS=pd.DataFrame(GLOBAL_XCHNGS)
GLOBAL_XCHNGS['GLOBAL_XCHNGS']=GLOBAL_XCHNGS[0]
GLOBAL_XCHNGS

"""# TIMEZONE KEYS TO DF"""

ZONES=pd.Series(T_ZNES)
ZONES=pd.DataFrame(ZONES)
ZONES

"""# DF with: TIMEZONE KEYS, EXGLOBAL_XCHNGS, LOCAL TIMES WITH AND WITHOUT DATES"""

ZONES['ZONES']=ZONES[0]
ZONES['CHNGES']=GLOBAL_XCHNGS['GLOBAL_XCHNGS']
ZONES['LOCAL_TIME_WITH_DATE']=LOCAL_TIMES_WITH_DATE['LOCAL_TIME_WITH_DATE']
ZONES['LOCAL_TIME_WITHOUT_DATE']=LOCAL_TIMES_WITHOUT_DATE['LOCAL_TIME_WITHOUT_DATE']
ZONES['TIMESORT']=pd.DataFrame(pd.to_datetime(ZONES['LOCAL_TIME_WITH_DATE'], format="%Y-%m-%d %H:%M:%S"))
ZONES=ZONES.drop([0, 'LOCAL_TIME_WITH_DATE'], axis=1)
ZONES


"""# NEW COLUMNS FOR MONTH, DAY, DAY OF WEEK"""

ZONES['MONTH'] = ZONES['TIMESORT'].dt.month

ZONES['DAY'] = ZONES['TIMESORT'].dt.day
ZONES['DAYOFWEEK'] = ZONES['TIMESORT'].dt.dayofweek

"""# ADD EXCHANGE OPEN AND CLOSE TO "zone" DATAFRAME"""

ZONES['FIRST_OPEN']=FIRST_OPEN
ZONES['FINAL_CLOSING_TIME']=FINAL_CLOSING_TIME

ZONES.index=ZONES['CHNGES']

ZONES.sort_values(by='TIMESORT')
More data preparation next step, where we will crawl through to determine whether an exchange is open or closed at the moment.
STAMPS=['STAMPS']
for i in range(len(ZONES)):
  STAMPS.append(pd.Timestamp(ZONES['TIMESORT'].iloc[i]).timestamp())#.values.astype('int')

CHECKR=pd.DataFrame(STAMPS[1:])
CHECKR

STAMPS=['STAMPS']
for i in range(len(ZONES)):
  STAMPS.append(pd.Timestamp(ZONES['TIMESORT'].iloc[i]).timestamp())#.values.astype('int')

CHECKR=pd.DataFrame(STAMPS[1:])
CHECKR

STAMPS=['opens']
for i in range(len(ZONES)):
  STAMPS.append(pd.Timestamp(ZONES['FIRST_OPEN'].iloc[i]))#.values.astype('int')
CHECKR['OPENRS']=pd.DataFrame(STAMPS[1:])
CHECKR

STAMPS=['closrs']
for i in range(len(ZONES)):
  STAMPS.append(pd.Timestamp(ZONES['FINAL_CLOSING_TIME'].iloc[i]))#.values.astype('int')
CHECKR['CLOSRS']=pd.DataFrame(STAMPS[1:])
CHECKR

STAMPS=['STAMPS']
for i in range(len(ZONES)):
  STAMPS.append(pd.Timestamp(ZONES['TIMESORT'].iloc[i]))#.values.astype('int')
CHECKR['CURRENT_TIME']=pd.DataFrame(STAMPS[1:])
CHECKR

CHECKR['OPEN_MONTH'] = CHECKR['OPENRS'].dt.month
CHECKR['OPEN_DAY'] = CHECKR['OPENRS'].dt.day
CHECKR['CLOSE_MONTH'] = CHECKR['CLOSRS'].dt.month
CHECKR['CLOSE_DAY'] = CHECKR['CLOSRS'].dt.day
CHECKR['NOW_MONTH'] = CHECKR['CURRENT_TIME'].dt.month
CHECKR['NOW_DAY'] = CHECKR['CURRENT_TIME'].dt.day
CHECKR

CHECKR.index=ZONES.index
CHECKR

ALREADYOPEN=['ALREADYOPEN']
ALREADYCLOSED=['ALREADYCLOSED']
Use a 'for' loop to check and report open/closed status of markets, and to append the lists we just made to include open/closed = True/False flags. Plus, it delivers natural language summaries of the calculation steps and market open/closed status per exchange for human evaluation.
for i in range(len(CHECKR)):
print(' ')
print('****', CHECKR.index[i], '****')
print(' ')
print(' ')
print('this is when it opens:', CHECKR['OPENRS'].iloc[i])
print('this is when it CLOSES_OR_TAKES_LUNCH:', CHECKR['CLOSRS'].iloc[i])
print('this is now:', CHECKR['CURRENT_TIME'].iloc[i])
if int(CHECKR['OPEN_MONTH'].iloc[i]) is int(CHECKR['NOW_MONTH'].iloc[i]):
print('same month')
print ('SO CHECK THE ****DAY****')
if int(CHECKR['OPEN_DAY'].iloc[i]) is int(CHECKR['NOW_DAY'].iloc[i]):
print('same day')
print('SO WAS IT ****ALREADY OPEN TODAY****? THE ANSWER IS: ', CHECKR['OPENRS'][i]<CHECKR['CURRENT_TIME'][i])
ALREADYOPEN.append(CHECKR['OPENRS'][i]<CHECKR['CURRENT_TIME'][i])
print('AND WAS IT ****ALREADY CLOSED TODAY****? THE ANSWER IS: ', CHECKR['CLOSRS'][i]<CHECKR['CURRENT_TIME'][i])
ALREADYCLOSED.append(CHECKR['CLOSRS'][i]<CHECKR['CURRENT_TIME'][i])
else:
print('diff day: SUBTRACT A **DAY** FROM NOW DAY')
print(' ')
print(CHECKR['CURRENT_TIME'].iloc[i])
print('THIS IS THE DATETIME WE USE IN THE CALCULATION: ', CHECKR['CURRENT_TIME'].iloc[i]-pd.Timedelta('1 day'))
print(' ')
print('SO WAS IT ****ALREADY OPEN TODAY****? THE ANSWER IS: ', CHECKR['OPENRS'][i]<CHECKR['CURRENT_TIME'][i]-pd.Timedelta('1 day'))
ALREADYOPEN.append(CHECKR['OPENRS'][i]<CHECKR['CURRENT_TIME'][i]-pd.Timedelta('1 day'))
print('AND WAS IT ****ALREADY CLOSED TODAY****? THE ANSWER IS: ', CHECKR['CLOSRS'][i]<CHECKR['CURRENT_TIME'][i]-pd.Timedelta('1 day'))
ALREADYCLOSED.append(CHECKR['CLOSRS'][i]<CHECKR['CURRENT_TIME'][i]-pd.Timedelta('1 day'))
Add the new lists as columns. Was the exchnage already open today? Was it already closed? We now have our answers in the last two columns.
CHECKR['ALRDYOPEN']=ALREADYOPEN[1:]
CHECKR['ALRDYCLOSE']=ALREADYCLOSED[1:]
CHECKR.sort_values(by='CURRENT_TIME',  ascending=False)
Next, use the open and closes statuses of markets to assign colors to the countries closest associated with the geographical locations of the exchanges. Blue means we are in open hours currently, black means we are outside market hours.
CHECKR['ALRDYOPEN']

COLORER=['colors']
for i in range(len(CHECKR)):
  if str(CHECKR['ALRDYOPEN'][i]) is 'True':
    if str(CHECKR['ALRDYCLOSE'][i]) is 'False':
      COLORER.append('midnightblue')
    else:
      COLORER.append('k')
  else:
    COLORER.append('k')
Finally, make and execute a function that puts the color on the map using Geopandas.
def MAPPER():

  WORLD = gpd.read_file(gpd.datasets.get_path('naturalearth_lowres'))

  ax2 = WORLD.plot(figsize=(20,30), edgecolor='k', color='darkslategrey')

  WORLD[WORLD.name == "South Korea"].plot(edgecolor=u'white', color=COLORER[1], ax=ax2)
  WORLD[WORLD.name == "Japan"].plot(edgecolor=u'white', color=COLORER[2], ax=ax2)
  WORLD[WORLD.name == "China"].plot(edgecolor=u'white', color=COLORER[3], ax=ax2)
  WORLD[WORLD.name == "India"].plot(edgecolor=u'white', color=COLORER[4], ax=ax2)
  WORLD[WORLD.name == "India"].plot(edgecolor=u'white', color=COLORER[5], ax=ax2)
  WORLD[WORLD.name == "Germany"].plot(edgecolor=u'white', color=COLORER[6], ax=ax2)
  WORLD[WORLD.name == "Switzerland"].plot(edgecolor=u'white', color=COLORER[7], ax=ax2)
  WORLD[WORLD.name == "Netherlands"].plot(edgecolor=u'white', color=COLORER[8], ax=ax2)
  WORLD[WORLD.name == "Sweden"].plot(edgecolor=u'white', color=COLORER[9], ax=ax2)
  WORLD[WORLD.name == "South Africa"].plot(edgecolor=u'white', color=COLORER[10], ax=ax2)
  WORLD[WORLD.name == "United Kingdom"].plot(edgecolor=u'white', color=COLORER[11], ax=ax2)
  WORLD[WORLD.name == "Australia"].plot(edgecolor=u'white', color=COLORER[12], ax=ax2)
  WORLD[WORLD.name == "Brazil"].plot(edgecolor=u'white', color=COLORER[13], ax=ax2)
  WORLD[WORLD.name == "United States of America"].plot(edgecolor='white', color=COLORER[14], ax=ax2)
  WORLD[WORLD.name == "United States of America"].plot(edgecolor='white', color=COLORER[15], ax=ax2)
  WORLD[WORLD.name == "Canada"].plot(edgecolor=u'white', color=COLORER[16], ax=ax2)
  WORLD[WORLD.name == "Saudi Arabia"].plot(edgecolor=u'white', color=COLORER[17], ax=ax2)
  WORLD[WORLD.name == "China"].plot(edgecolor=u'white', color=COLORER[18], ax=ax2)
  WORLD[WORLD.name == "China"].plot(edgecolor=u'white', color=COLORER[19], ax=ax2)
  WORLD[WORLD.name == "Taiwan"].plot(edgecolor=u'white', color=COLORER[20], ax=ax2)
  WORLD[WORLD.name == "New Zealand"].plot(edgecolor=u'white', color=COLORER[21], ax=ax2)

  #ax2.axis('off')
  plt.show()

MAPPER()
This data table holds all the key info for reference including current local time, opening, and closing times.
CHECKR[CHECKR.columns[CHECKR.columns.isin(['OPENRS','CLOSRS', 'CURRENT_TIME', 'ALRDYOPEN' ,'ALRDYCLOSE'])]].sort_values(by='CURRENT_TIME', ascending=False).style.set_properties(**{'background-color': 'black',
                           'color': 'white',
                           'border-color': 'white'})
References & Resources
Jordahl, K. (2014). GeoPandas: Python tools for geographic data. URL: https://Github.Com/Geopandas/Geopandas.
J. D. Hunter, "Matplotlib: A 2D Graphics Environment", Computing in Science & Engineering, vol. 9, no. 3, pp. 90-95, 2007.
McKinney, W., & others. (2010). Data structures for statistical computing in python. In Proceedings of the 9th Python in Science Conference (Vol. 445, pp. 51–56).
Bishop, S. (2022). pytz: World timezone definitions, modern and historical. URL: https://github.com/stub42/pytz.