5 Red Weekly Successive Candles in Bitcoin Price Chart After 3,5 Years
After weekly close in Bitcoin price, There seem 5 red weekly successsive candle. We saw that candles 3,5 years ago..
It is rare move in Bitcoin chart. I didnt expect we would see 5 red weekly successive candles...
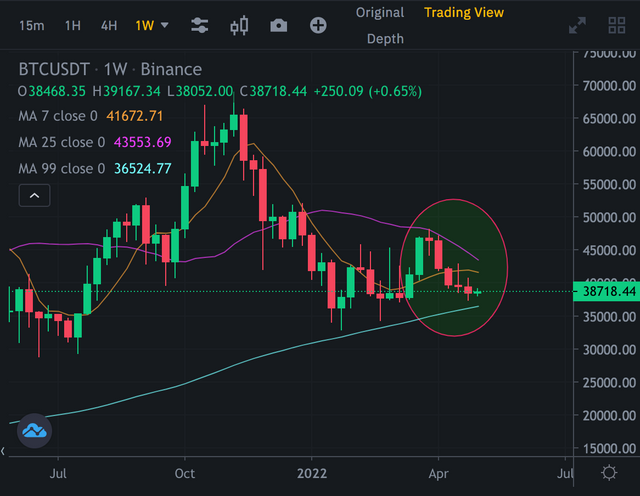
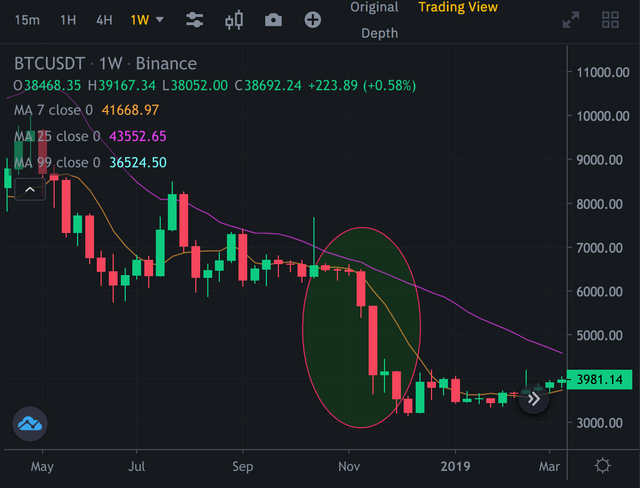
Here is last same move of Bitcoin. We saw it at the end of 2018. Bitcoin price dumped 50% after this red candles. Now Bitcoin price dumped 20%....
This week is very important. Will we see 6th red candle in weekly chart?
Of course it is possible. But If we see 6th red candle in Bitcoin chart, We should be certain that we are in bearish season for Bitcoin..
Bitcoin is not is bearish season now. Lots of altcoins entered bearish season.
I saw a few altcoins havent entered bearish season. ETH, Hive, TRX, BNB, Solana Price charts are on the bottom. If Bitcoin price drops below 35K this week, these altcoins will enter bearish season... They are in critical level...
Here you can see BNB price chart. It is still bullish!
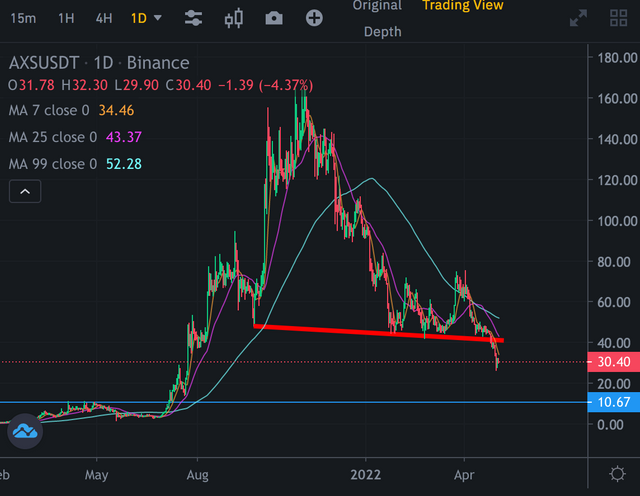
Lets look at AXS price chart and see how AXS entered bearish season..

As I said, this week is very important for cryptomarket.. We will see..
You're right! Last Month, T'was truly an erratic one for BTC, as expected, altcoins dipped up to 5x! So scary. Indeed, from your analysis, this 6th week is very important. Personally, I think the market has been consolidating so far, so I'm hopeful for a consistent uptrend in this month of May, I guess if we keep seeing the bullish candlesticks,then it's trouble in town...haha. Anyways, I hope we go back to the green zone though. Thanks for sharing.