Bitcoin Cash Parabolic Rally Update! | BCH Price Prediction 2023
Hi friends hope you are well and welcome to the new update on Bitcoin cash (BCH)
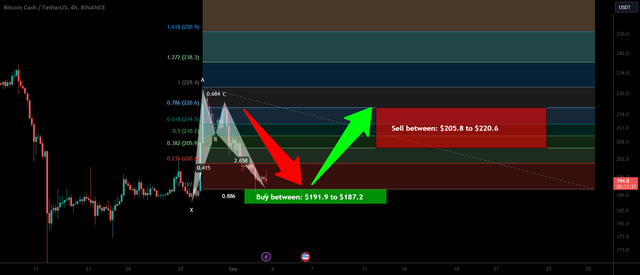
Harmonic bullish reversal move:
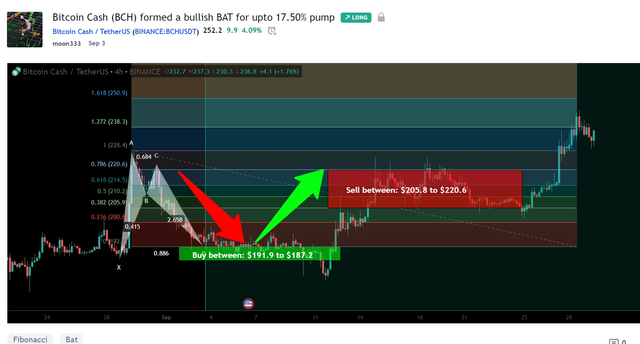
Before starting the analysis of BCH, I would like to share with you my most recent trade signal for Bitcoin cash, which I shared few days ago. That was a harmonic bullish reversal BAT move, which BCH formed on a 4-hour time frame, and recently it has begun a successful bullish reversal form the potential reversal zone of this move, and rallied more than 30%.
After the bullish price reversal:
https://www.patreon.com/posts/bitcoin-cash-bch-88698526
For detailed analysis, you can also watch the below video:
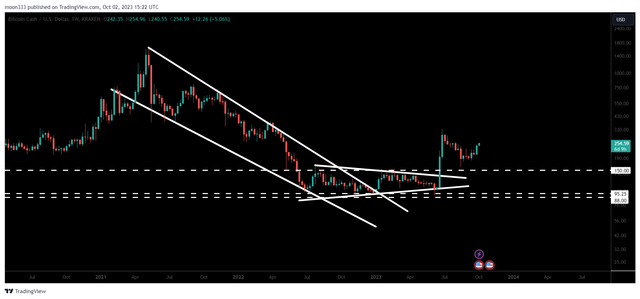
Massive breakouts:
On a weekly time frame chart, from March 2021 up till January 2023 the priceline of Bitcoin cash was moving inside a very big falling wedge pattern, and finally in the second week of January 2023 Bitcoin cash broke out this huge wedge pattern but got stuck inside in another symmetrical triangle and in the second week of June 2023, after testing the support of this triangle BCH rallied almost 200% and broke out the resistance of this pattern as well.
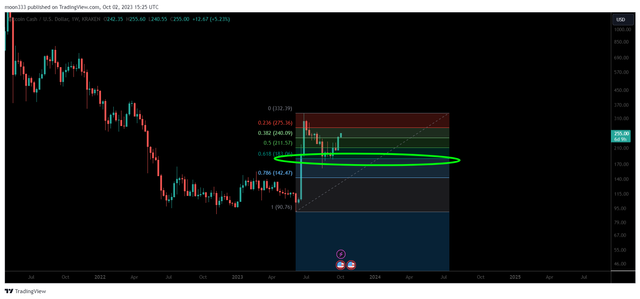
Dropped in golden pocket:
After the 200% rally the price was dropped 61.8% that is considered as a golden pocket of Fib retracement level. Finally it has happened and BCH has begun nice reversal move
Broke out the channel:
On a daily time frame, for almost 77 days priceline was moving inside a long down channel. Finally it broke out this channel on 15th of September 2023. After the break out the price and got rejected by the reference of $226, it has also broken out this resistance as well. There is also a support at $180, which is also a recent swing low before this channel’s breakout, therefore, below this support the stop loss can be placed, in case of trading this breakout.
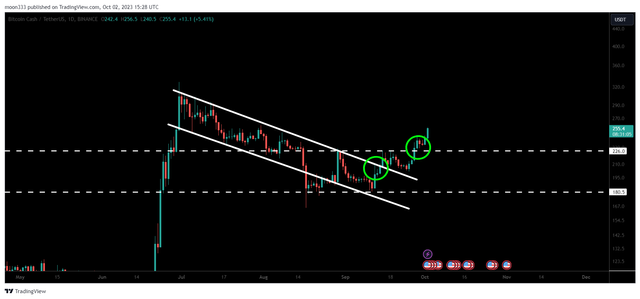
Targets:
Target for the recent channel’s breakout is at the top of the channel, which is approximately $315, and if we take a look at the target for the previous breakout from huge falling wedge pattern, which has already happened on a weekly time frame, that is at the top of the wedge, which can be between $1600 to $1800.
Conclusion:
For the past 77 days the priceline Bitcoin cash was moving continuously to the downside, but after breaking out the recent down channel and starting a bullish reversal from a golden pocket it is confirming a trend reversal from the downside the outside.
For daily trading signals you can join me as a member at Patreon or YouTube by following the below links
https://www.youtube.com/@moon333/membership
https://www.patreon.com/moon333
Link for the Binance exchange:
https://www.binance.com/?ref=11256882
Link for the trading view account:
https://www.tradingview.com/?aff_id=17746