Steemit Crypto Academy Season 5 Week 6 [Beginner's Course] - Confluence Trading: By @zeebhutta
Designed by @zeebhutta Using Canva

Greeting Everyone,
This is my homework post for the 6th week of Crypto Academy in which I will be attempting the questions assigned by one of our esteemed professors @reminiscence01. He has taught us how we can trade with the confluence and gain maximum profits. I will be sharing much more details through the following questions.

1. Explain Confluence trading. Explain how a trade setup can be enhanced using confluence trading.
1. Explain Confluence trading. Explain how a trade setup can be enhanced using confluence trading.
Unlike forex or commodities, cryptocurrencies are not stable and are extremely volatile due to which they can either give a huge profit or get a trader rekt. That makes it important for everyone to trade professionally which can be done by using confluence trading through several technical indicators and price action. The reason to do so is that the crypto market is widely known for faking a breakout which gives a false signal that can result in loss. But it can be avoided by adding confluence on trade setups through confluence trading.
If we trade using a single technique, then there are huge chances that setup can hit a stop loss because it can’t be accurate at all. Not every indicator or price action strategy provides a perfect signal due to which experts always recommend adding much confluence on the setup by not relying on a single thing and using multiple tools. I will show you an example from the market so that you can understand why confluence trading is essential for everyone.
The mentioned chart of OMG/USDT indicates that was the price was making a series of higher highs which is a bullish sign. However, RSI shows that the asset was overbought which is a trend reversal sign but it was a fake signal as the price continued to pump. If I would have used several confluences, then it would have helped me to set a bias and get a clear insight about the future price.
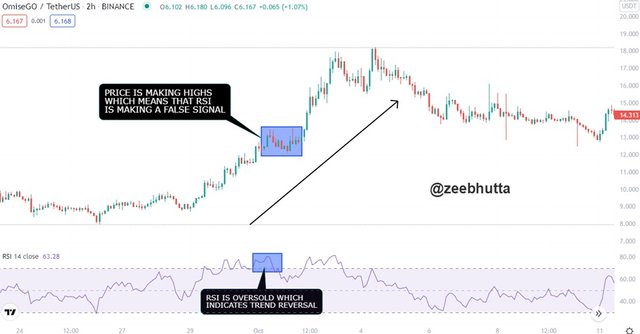
Confluence trading refers to a strategy in which around 2 or more trading tools are used so that better signals can be produced that can provide profits. As you can see from the aforementioned example that a trader would have been at a loss if only RSI was used but adding price action and other indicators would have easily provided clear insight and enhanced the setup.
2. Explain the importance of confluence trading in the crypto market?
2. Explain the importance of confluence trading in the crypto market?
As we know that crypto is highly volatile due to which not everyone can easily generate profits. Everything actually depends on the strategy and confluence trading is the most recommended and perfect one because it can help a trader to know where the market could be headed by using not one but multiple confluences.
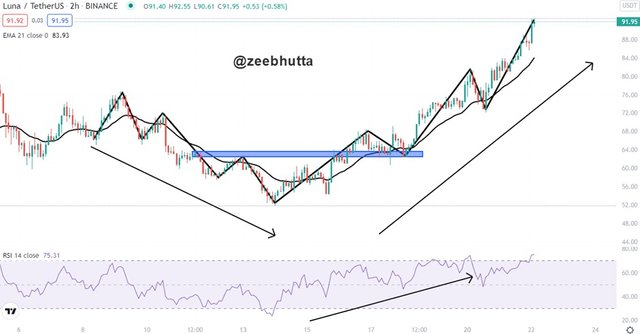
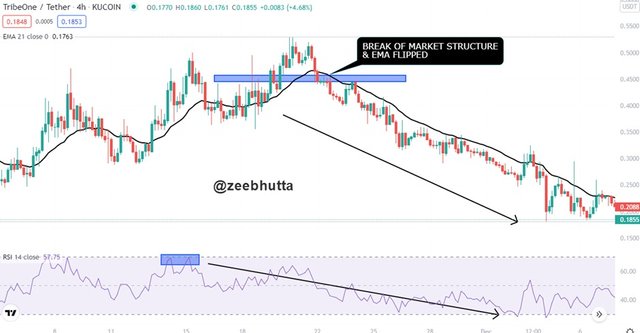
I have added an example of the LUNA/USDT chart which represents the importance of confluence trading. You can see that I have applied 3 tools that are market structure, EMA, and RSI to find the trend and trade accordingly. The price was bearish until it broke the previous low which is a trend reversal signal. 21 EMA was also below the price which is a bullish sign and RSI was in an uptrend as well. So, altogether all 3 tools were indicating bullish signs which means that I can long the asset with confidence.
A single tool is never advised by anyone because it can provide a false signal. Confluence trading strategy is best for everyone because multiple tools are used that can help a trader to find out if any of them is providing a fake signal or not. Additionally, it gives confidence about the setup. So, crypto traders should get a good grip on price action and indicators to find profitable trade setups otherwise breakouts can make it troublesome.
3. Explain 2-level and 3-level confirmation confluence trading using any crypto chart.
3. Explain 2-level and 3-level confirmation confluence trading using any crypto chart.
While finding a trade setup, it is widely recommended to use 2 or 3-level confirmation confluence trading as it can assist in finding a perfect entry point that can result in great profit. I will deliberately explain each of them so that you can also use them while finding your setups:
2-Level Confirmation Confluence Trading
2-Level Confirmation Confluence Trading
In 2-Level Confirmation Confluence Trading, we use only 2 tools to find a setup on the crypto market. Choosing tools depends upon traders but I personally prefer EMA as it works as a support and resistance line. The second tool that is used is RSI which shows potential trend reversal. If both tools add confluence to the same direction, then we can open trade accordingly.
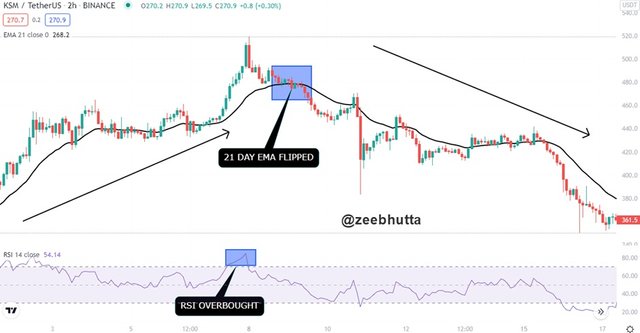
Let’s take the example of KSM/USDT. I applied 2 indicators that are RSI and 21 Day EMA. After a bullish rally, the price actually flipped the EMA line which is the sign of the bearish trend. But an indicator can fake out sometimes due to which I observed RSI which was in an overbought zone which is a sign of trend reversal.
Both indicators were adding confluence to the bearish market and you can observe that the price started a strong
downtrend move as indicated by the setup.
3-Level Confirmation Confluence Trading
3-Level Confirmation Confluence Trading
In this method, we use 3 tools to add confluence to a trade. Anyone can use their preferred indicators and price action strategy but I recommend identification of break of market structure, 21 Day EMA, and RSI. By combining all these tools, if they add confluence to the same direction, then I will be able to find a perfect setup.
I have represented an example on HAKA/USDT chart. The price was in a downtrend but it broke the market structure and the price was trading below the EMA line as well which means that is now bearish. In addition to that, RSI touched the 70 lines. So, all my tools were adding confluence to a downward trend which means that I can open a short position with great confidence.
4. Analyze and Open a demo trade on two crypto asset pairs using confluence trading. The following are expected in this question.
4. Analyze and Open a demo trade on two crypto asset pairs using confluence trading. The following are expected in this question.
a) Identify the trend.
a) Identify the trend.
b) Explain the strategies/trading tools for your confluence.
b) Explain the strategies/trading tools for your confluence.
c) What are the different signals observed on the chart?
c) What are the different signals observed on the chart?
Now I will analyze the chart pattern of 2 crypto charts through the confluence trading method with the help of my preferred tools and provide a detailed explanation. So, let’s start with the demo trades:
SHIB/USDT
Identifying the Trend
Identifying the Trend
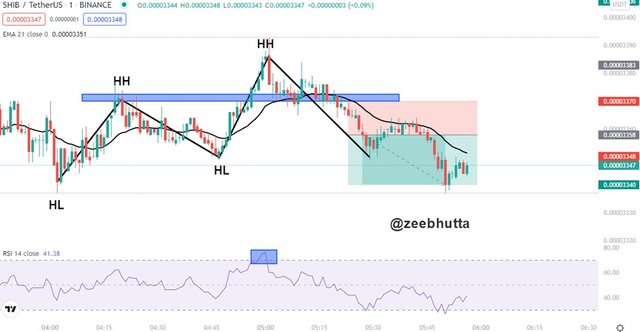
First thing first, I analyzed the market structure of SHIB/USDT and the price was making a series of highs but due to lack of bullish momentum, candles broke the previous high and formed a lower low which means that price is in the bearish trend. I have also marked the market structure on the attached chart.
Strategies & Tools Used For Confluence
Strategies & Tools Used For Confluence
I have used a 3-level confirmation strategy for this trade setup. I applied 21 Day EMA, RSI, and observed the market structure. The asset was trading above the EMA line which was later flipped indicating the bearish trend. RSI also touched the overbought zone and the market structure was also broken. Everything was adding confluence to downtrend.
Signal Observed on Chart
Signal Observed on Chart
As mentioned earlier, I used 3 tools for the technical analysis. The RSI was overbought which is a sign that price can change the trend so it means that the SHIB was bullish and it can start a downtrend soon. 21 Day EMA line was below the price and the market structure was broken as well. So, after considering these tools, I observed a sell signal.
Overall, the price was adding confluence to a downtrend so I opened a short position on the current market price with RR of 1:5 and you can see that my TP was hit giving me the profit of $90.
DOT/USDT
Identifying the Trend
Identifying the Trend
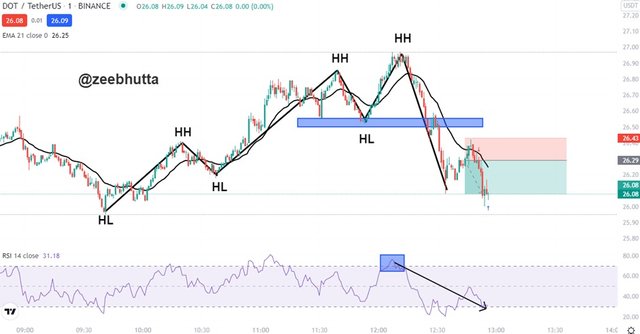
I started the chart analysis by identifying the trend. As you can see that I have marked every higher high and higher low that the price was making. It shows that it was in a bullish trend until it surpassed the previous high and made a low. It shows that the market structure has been broken and it is starting a downtrend.
Strategies & Tools Used For Confluence
Strategies & Tools Used For Confluence
You can see from the mentioned chart that I have applied RSI and 21 Day EMA along with price action. RSI was at an overbought zone which is a sign of trend reversal and the asset did start a bearish rally afterward. As for the EMA line, the price started to trade below that line which is a sign of a bearish trend. 3rd tool was price action in which I observed the break of market structure from bullish to bearish.
Signal Observed on Chart
Signal Observed on Chart
After applying 3 tools on DOT/USDT chart, I came to the point that the price is bearish which means that I can open a short position. I sold the asset on market price with RR of 1:5 and you can see that I was in profit as the TP was hit easily.
Conclusion
I would like to suggest everyone start confluence trading as the majority becomes the victim of fake breakout as lost their funds. A trader can use their preferred tools which should be a minimum of 2 so that a false signal can be identified and avoided right on time. My 2 demo trades are proof that it actually works and provides huge profit.

Thanks For Visiting My Post And Your Appreciation
Cc:
@reminiscence01

Sort: Trending
Loading...