Crypto Academy / S5W8- [Reading Special Bar Combinations] - Homework Post for @sachin08

Designed by @zeebhutta Using Canva

Greeting Everyone,
I hope everyone’s doing fine. This is my homework post for professor @sachin08. In the latest lecture, he has explained special bar combinations which are an alternate to candlestick patterns. I have discussed more about this amazing topic in my homework post which is as follow:

1- Explain Price Bars in your own words. How to add these price bars on Chart with proper screenshots?
1- Explain Price Bars in your own words. How to add these price bars on Chart with proper screenshots?
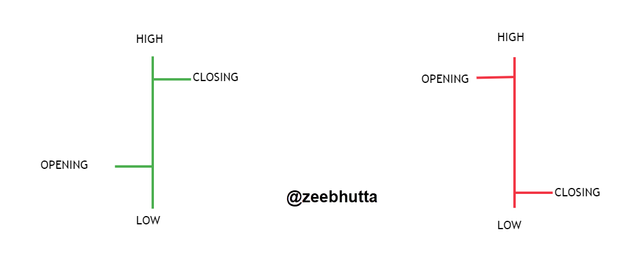
Price bars are just like candlestick patterns which show the opening and closing of the price along with high and lows according to the time frame. It represents data in a very unique form that can be understood by a trader with convenience. Although it shows the same data as a candle, but it is much simple and better to understand.
The bearish bars are marked with red color while the bullish bars are green. The color can be changed by the trader according to personal preferences. Price bars also represent the strength of bears and bulls which can be identified by the size of the bars. Suppose that the body of a red bar is long which means that bears are in control of the market and the long green bar represents those bulls are in control. So, it can provide vital information to a trader in a very easy way.
Price bars can be easily added to the chart in just a few steps. I will show you how it is done in the tradingview so that you can start your practice on these bars.
The first thing is to open the tradingview and click on the candles box that will be next to the timeframe. Once you click, it will open a drop-down box where you have to choose bars which will be the first option.
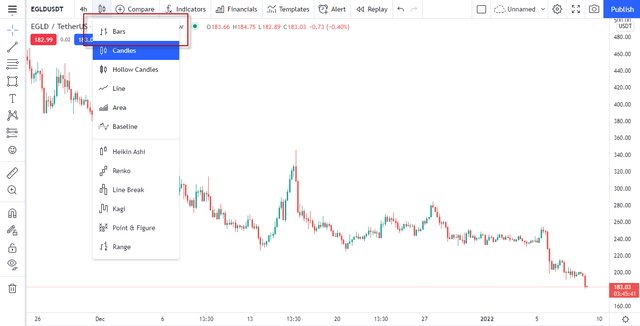
Price bars will be instantly applied and candlestick will be removed from the chart.
2- How to identify trends using Price Bars. Explain both trends. (Screenshots required)
2- How to identify trends using Price Bars. Explain both trends. (Screenshots required)
Identifying the trend is very easy and you will find it much easier than candlestick patterns. All you need is a little bit of knowledge about market structure and price bar structure so that you can find the trend. I will also demonstrate it for you in both bullish and bearish examples:
Bullish Trend
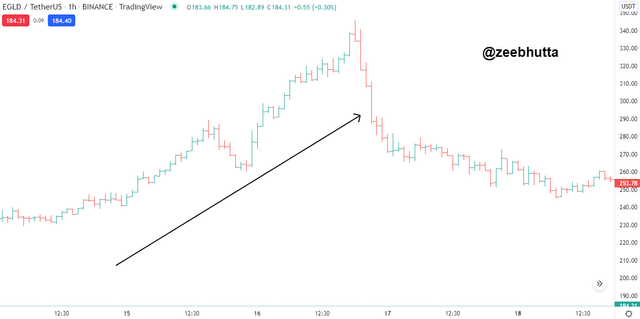
Once you see that the bars are making a series of higher high and high low, then it means that the price is simply in an uptrend. You can enter the trade when the price retraces and makes a higher low and then book profit accordingly.
The below-mentioned chart of EGLD/USDT shows that the price was bullish as it was making highs and respecting the previous low. Thus, I was able to find the trend at a single glance and a little bit of observation of market structure helped as well.
Bearish Trend
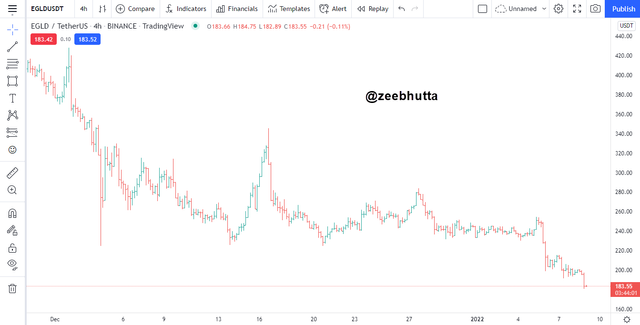
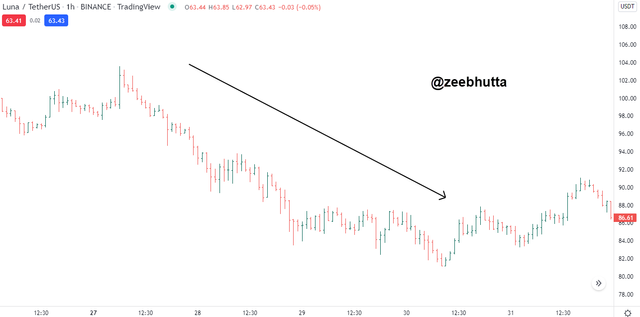
Identifying bearish trends is very easy through price bars as all you need is to observe whether the price is making a series of lows or not, if they are making, then you can deduce that the price is in a downtrend and you can open a short position accordingly.
The attached chart of LUNA/USDT shows that price is making lower low and lower high which is a sign of a healthy downtrend. So, a trader can easily open a short position once the trend is identified through the break of the market structure.
3- Explain the Bar Combinations for Spending the Day inside for both conditions. (Screenshots required)
3- Explain the Bar Combinations for Spending the Day inside for both conditions. (Screenshots required)
Spending a day inside refers to the scenario in which the opening and closing of the price are enveloped by the previous bar. It occurs in both bullish and bearish scenarios which simply indicates that buyers and sellers are confused and the trend can’t be predicted at the moment. I will explain both scenarios for better understanding:
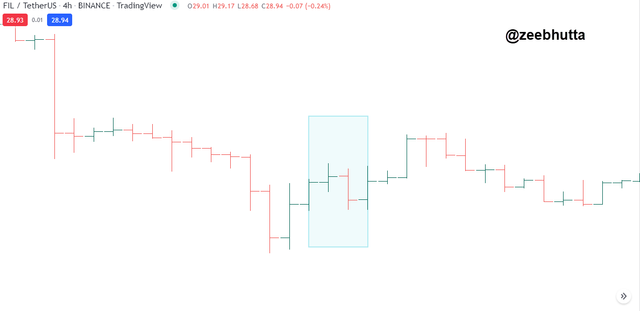
Spending the Day Inside – Bullish
You can see from the below-mentioned chart that I have marked the “spending day inside” for the bullish scenario. It shows that the present-day high is lower than the previous day's high and the low is higher than the previous day's low. It is simply representing indecision in the market between buyers and sellers.
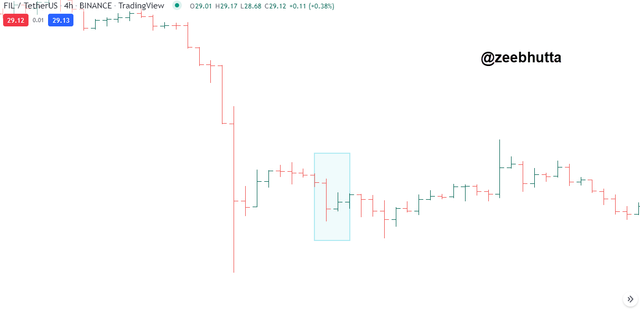
Spending the Day Inside – Bearish
This is the bearish example of “spending the day inside”. It shows that the bullish bar which was formed earlier and the bearish candle’s low is formed below the previous candle’s low. Also, the high is lower than the previous candle which simply means that neither bulls nor bears are in control of the market.
4- Explain the Bar Combinations for Getting outside for the Day for both conditions. (Screenshots required)
4- Explain the Bar Combinations for Getting outside for the Day for both conditions. (Screenshots required)
This scenario is pretty much similar to the engulfing pattern of the candlesticks. However, in the bar case, the high and low will be equal to closing and opening price and shows that bears and bulls are in complete control of the assets. Let’s take a closer look at the examples:
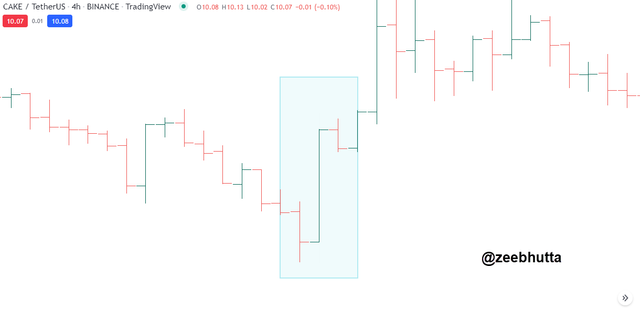
Getting outside for the day – Bullish
Here’s the bullish example of the “Getting outside for the day”. You can observe from the highlighted bars that the opening of the price is at the low of the previous candle while the closing is at the new high. It is the sign of a new bullish trend and shows that buyers are getting in control.
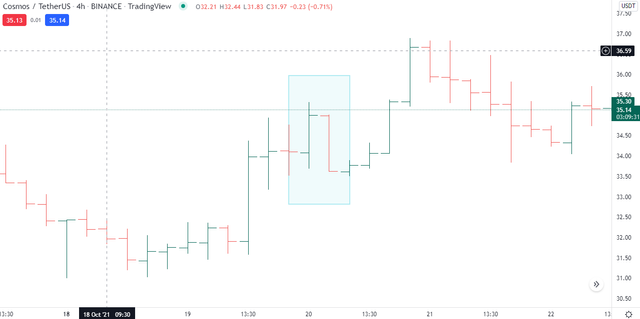
Getting outside for the day - Bearish
I have marked the “getting outside for the day” on the COSMOS/USDT chart which shows that the open is at the high of the previous candle and the close is at the low. It is the sign that bears have taken control of the market and the price will start a downtrend.
5- Explain the Bar Combinations for Finding the close at the open for both conditions in each trend. (Screenshots required)
5- Explain the Bar Combinations for Finding the close at the open for both conditions in each trend. (Screenshots required)
Finding the close at the open is a trend reversal signal which can be only found through price bars. They are very easy to identify and the result is accurate most of the time. Let’s see how it works on both bullish and bearish scenarios:
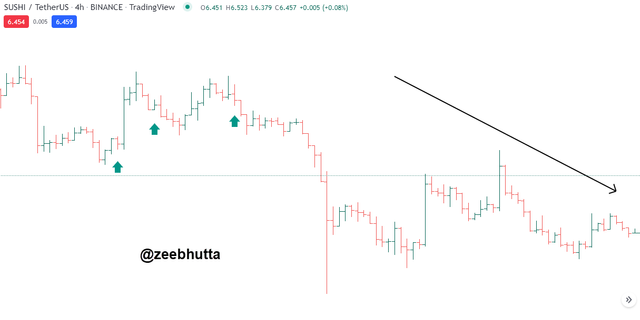
Finding the Close at the Open – Bearish
You can see from the below-mentioned chart of SUSHI/USDT that a total of 3 candles was formed whose closing was very near to opening. The closing was near to the low which predicts that bears could take over the asset and the arrow trendline shows that the price started a downtrend as well.
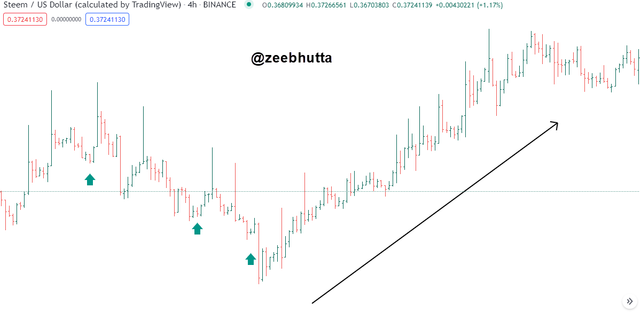
Finding the Close at the Open – Bullish
Now here’s the bullish example of close at the opening. The chart of STEEM/USDT shows that I have marked 3 price bars whose candle closing was near to the opening. It represents that there’s uncertainty in the market but we have to predict whether the downtrend will continue or it will reverse. So, I observed that the opening was near the low which simply means that trend could change now. The price started an uptrend as predicted.
6- Conclusion
The majority of traders are using candlestick patterns for trading and I believe that price bars should be considered as well because there are some profitable trading strategies that can be only done through bars. It represents the data in the simplest form and helps the trader to identify the trend in no time. So, it was interesting to learn something apart from candlesticks and the credit simply goes to the professor.

Thanks For Visiting My Post And Your Appreciation
Cc:
@sachin08

Sort: Trending
Loading...