Crypto Academy / S5W4- [Puria Method Indicative Strategy] - Homework Post for @utsavsaxena11

Designed by @zeebhutta Using Canva

Greeting Everyone,
This is my homework post for the 4th week of Steemit Crypto Academy. I have acquired great knowledge about a well-known trading strategy that is widely known as The Puria Method Indicative Strategy. You can know more about this strategy by going through the following sections:

1. Explain Puria method indicative strategy, what are its main settings. which timeframe is best to setup this trade and why? (Screenshot needed and try to explain in detail)
1. Explain Puria method indicative strategy, what are its main settings. which timeframe is best to setup this trade and why? (Screenshot needed and try to explain in detail)
PURIA METHOD INDICATIVE STRATEGY
There are numerous trading strategies but The Puria Method Indicative Strategy is considered as the most profitable one by countless experts. This scalping strategy gained the attention of everyone in 2010 and since that, it is widely adopted to make small gains in a quick span of time.
What makes this strategy so effective for beginners and experts is that it required only 2 Weighted Moving Average (WMA) and Moving Average Convergence Divergence (MACD). So, with the help of these 3 indicators, a trader can easily find the perfect entry and exit point. However, custom settings are used for these technical indicators that vary from person to person.
It is often said that “Trend is Your Friend” and that applies to this strategy as we trade with the trend. That’s why we use 2 WMA to identify the trend of the asset including potential support/resistance while MACD filter the entry and exit point.
MAIN SETTING OF PURIA METHOD INDICATIVE STRATEGY
In order to trade through the puria method indicative strategy, we have to make some changes in the indicators setting so that we can get an accurate result. Let’s take a look at the settings for WMA and MACD and how it can be done:
WEIGHTED MOVING AVERAGES
Since we trade with the trend in this strategy, we have to identify the direction of price, and custom weighted moving averages are used to do so. It also tells us about support and resistance. We use a total of 2 WMAs with different settings.
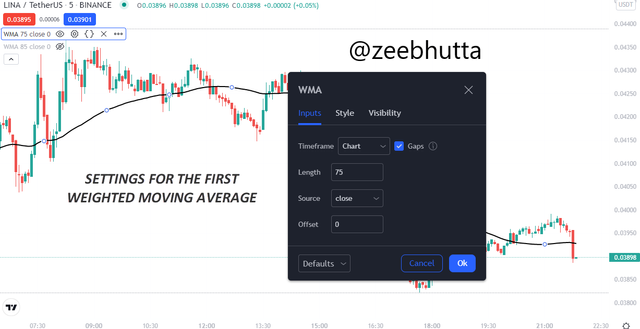
For the first WMA, we have to change the length to 75 and the low will be chosen for the source from the provided options. The colors should be different from the candlesticks otherwise it will become confusing while trading. Take a look at the below-mentioned image for a clear understanding of the settings.
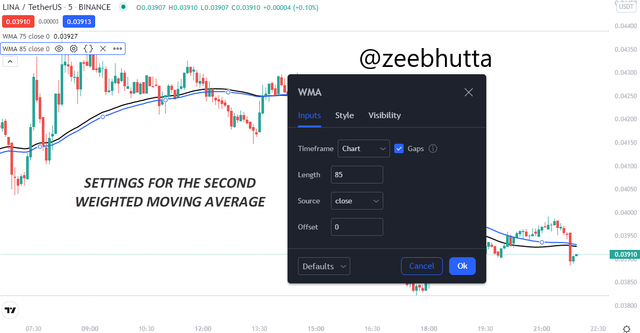
Now comes the settings for the 2nd weighted moving average. The length will be 85 and the source will be closed. With these changes, you will be done with both WMA. You can also refer to the following image for clear insight on the settings for the second WMA.
MOVING AVERAGE CONVERGENCE DIVERGENCE
MACD is used in this strategy to find out the perfect entry and exit signal. However, the basic settings won’t be suitable due to which we have to make some alterations.
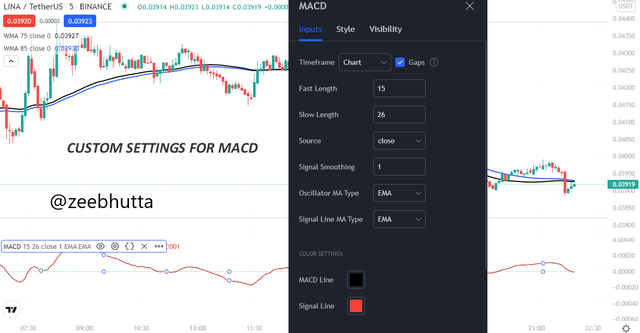
The first thing is to change the fast length to 15 and the slow length to 26. Next, we have to set the signal smoothing to 1. Once done with all these settings, the MACD won’t look as it usually does as the signal line will be visible only. Have a look at the mentioned image to find out the final settings for MACD.
BEST TIMEFRAME FOR PURIA METHOD INDICATIVE STRATEGY
When it is about choosing a time frame for trading this scalping strategy, it is up to the trader’s choice but the majority prefers smaller time frames so that maximum positions can be opened and profit can be booked accordingly. Personally, I prefer to use 5 minutes or 1-minute timeframes while using this strategy but it is not advised for longer times frames like days or weeks.
2. How to identify trends in the market using the puria method. Is it possible to identify trend reversal in the market by using this strategy? Give examples to support your article and explain them. (screenshot needed)
2. How to identify trends in the market using the puria method. Is it possible to identify trend reversal in the market by using this strategy? Give examples to support your article and explain them. (screenshot needed)
It is very easy to identify the trend with the help of The Puria Method Indicative Strategy as the technical indicators that we use simply give us a clear insight into whether the asset is bullish or bearish. Let me show you examples of both scenarios so that you can clearly understand how to identify the trend:
BULLISH TREND
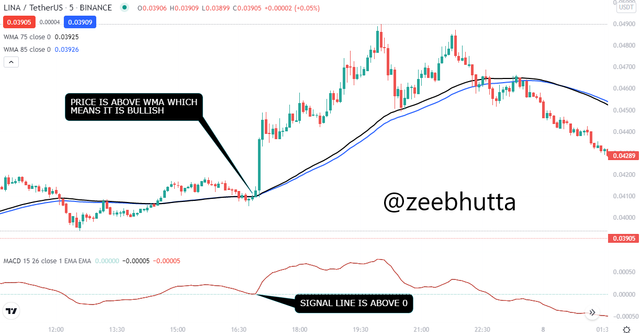
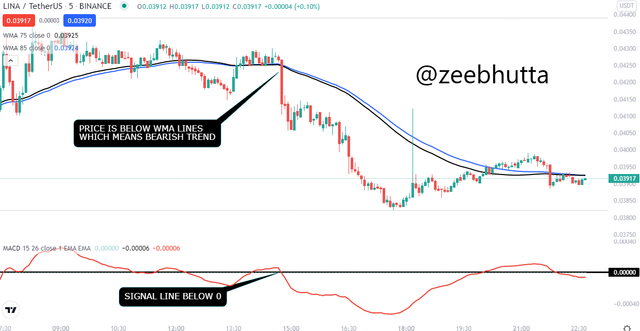
The uptrend can be easily identified through the puria method as the price of the asset will be above both WMA. Along with that, the MACD signal line will add more confluence as it will be moving above the 0 which means that price is currently bullish. The following chart of LINA/USDT also shows that the price was bullish when it was above the WMAs and the signal line of MACD was also above 0. Thus, indicating a bullish trend.
BEARISH TREND
In order to identify the bearish trend through the puria method, we have to see if the price is below the WMA lines or not. If it is moving below the WMA lines, then we can say that it is bearish. Plus, the signal line of MACD below 0 also indicates a bearish trend. The same chart of LINA/USDT shows that the price was below the WMA lines and MACD’s signal lines were below 0 which is a bearish sign. However, the price can become bullish once it flips the WMA lines.
TREND REVERSAL
We can easily detect the potential trend reversal with the help of indicators that we use in the puria strategy. The signal line of MACD, WMAs, and price action will be observed to identify the sign of trend reversal. It can assist the trader in predicting the price action and managing trades accordingly. I will show you examples of both bullish and bearish trend reversals.
If you want to find the trend reversal in the bullish market, then you have to carefully observe the WMAs and MACD. When the price is moving below the WMA and the Signal line comes below 0, then it is the sign of bearish trend reversal.
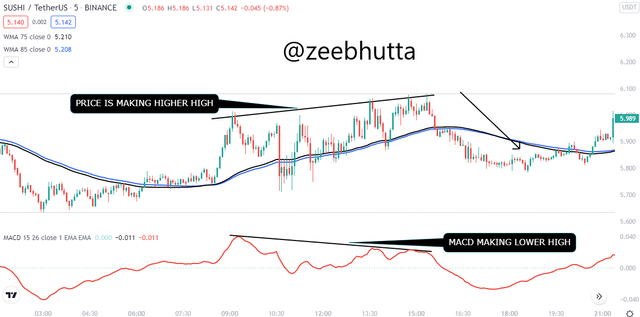
Further, we can identify divergence by observing price and signal line. If the price makes a higher high and the signal line makes a lower high, then it is the sign that the price will be flipped and you can also see that from the below-mentioned image.
BULLISH TREND REVERSAL
Bullish trend reversal can be identified when the price crosses the WMA lines and start moving above them. Further, the signal line will be above 0. So, when both indicators add confluence to a bullish trend, it means that price will opt for an uptrend.
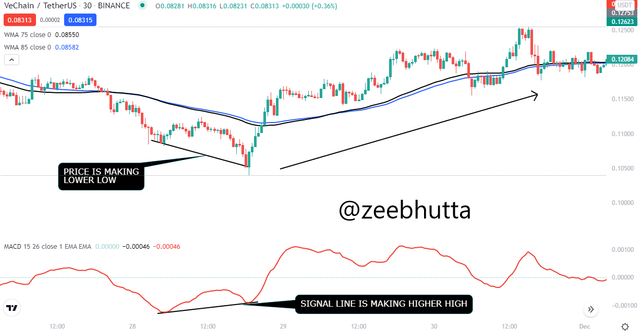
Another effective way to identify trend reversal is through bullish divergence. Take the example of the VET/USDT chart. The price is making lower lows while the signal line was making a higher low. It indicates that bears are losing control of the market and prices will become bullish.
3. In the puria strategy, we are using MACD as a signal filter, By confirming signals from it we enter the market. Can we use a signal filter other than MACD in the market for this strategy? Choose one filter (any Indicator having 0 levels) and Identify the trades in the market. (Screenshot needed).
3. In the puria strategy, we are using MACD as a signal filter, By confirming signals from it we enter the market. Can we use a signal filter other than MACD in the market for this strategy? Choose one filter (any Indicator having 0 levels) and Identify the trades in the market. (Screenshot needed).
The stochastic indicator is widely used by professional traders as it gives insight into the state of assets whether it’s overbought or oversold. When the lines are above 75 and below 100, then it means that the asset is oversold and it can make a retracement. The same goes for the oversold level which is between 0 and 25.
I will be using this technical indicator as a signal filter in the Puria Strategy so that I can take perfect entry and exit trade accordingly. Let’s see an example for both the buy and sell scenario.
SELL SIGNAL
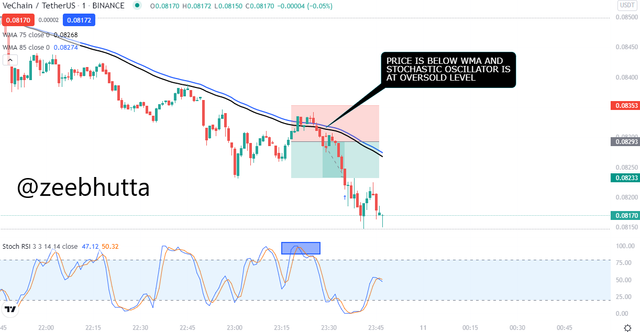
As we have learned that when the price is below the WMA lines, it means that it is in a bearish trend. Now, we will observe the stochastic oscillator to find the entry point. As you can see the highlighted mark, indicates that the asset is oversold so that’s the perfect time for us to open a short position.
So, I sold the assets with a risk to reward ratio of 1:1 and you can see that the TP was hit.
BUY SIGNAL
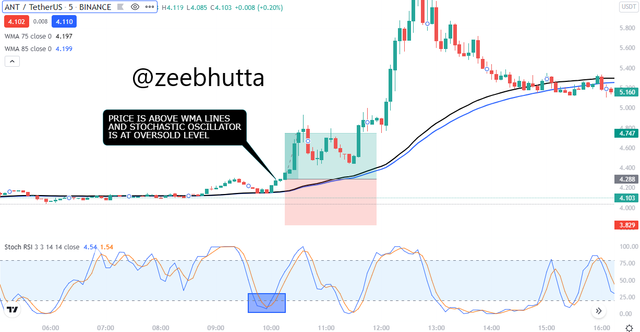
As you can observe from the below-mentioned image the price is above the trendline which means it is bullish. Plus, the stochastic oscillator is ranging between 0 and 25 which indicates that the asset is oversold which means that we are good to open a long position.
So, I enter the trade with risk to reward ratio of 1:1 and the price did hit my TP.
4. Set up 10 demo Trades (5 buying and 5 selling ) on 5 cryptocurrency pairs using puria method indicative strategy. Explain any 2 of them in detail. Prepare a final observation table having all your P/L records in these 5 trades.
4. Set up 10 demo Trades (5 buying and 5 selling ) on 5 cryptocurrency pairs using puria method indicative strategy. Explain any 2 of them in detail. Prepare a final observation table having all your P/L records in these 5 trades.
Now I will take 10 demo trades on TradingView through the puria method out of which 5 are about selling and the rest 5 about buying. After taking complete trades, I will share the result by filling the table’s components provided by the professor.
BUYING DEMO TRADES
SHIB/USDT
SHIB/USDT
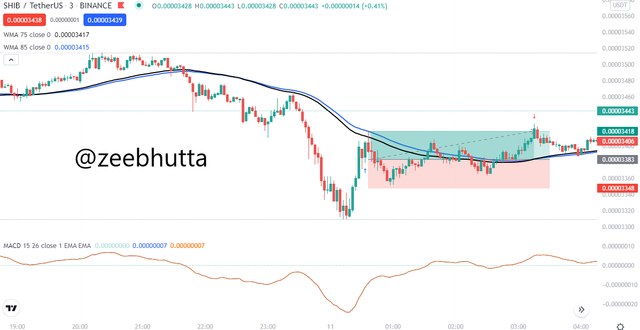
The price of SHIB/USDT was in an uptrend as it is above the WMA lines. In addition to that, signal line of MACD was also above 0 which fulfills our criteria to open a long position so I purchased the asset with RR of 1:1. Later, the profit was booked as the price hit the TP.
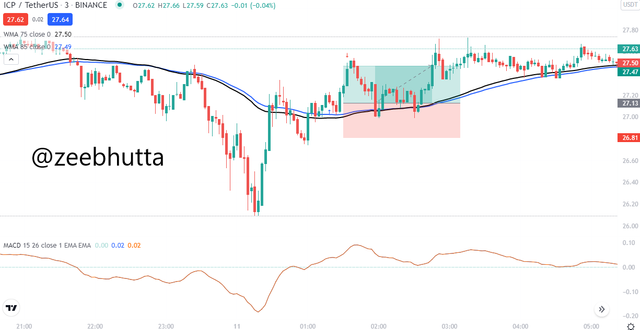
ICP/USDT
ICP/USDT
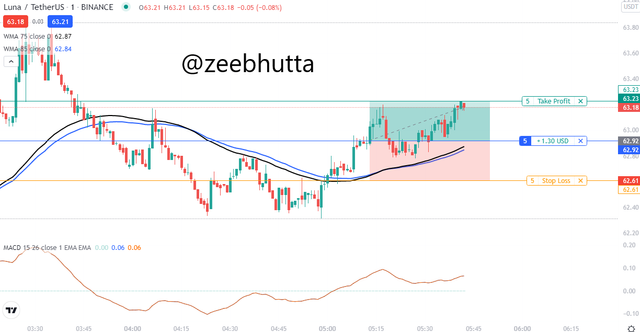
LUNA/USDT
LUNA/USDT
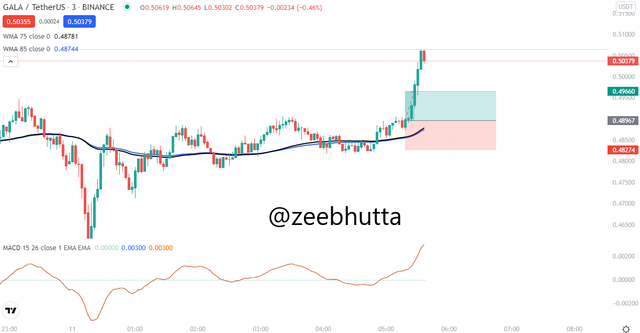
GALA/USDT
GALA/USDT
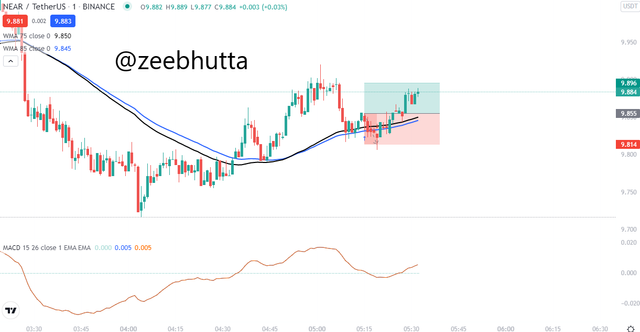
NEAR/USDT
NEAR/USDT
SELLING DEMO TRADES
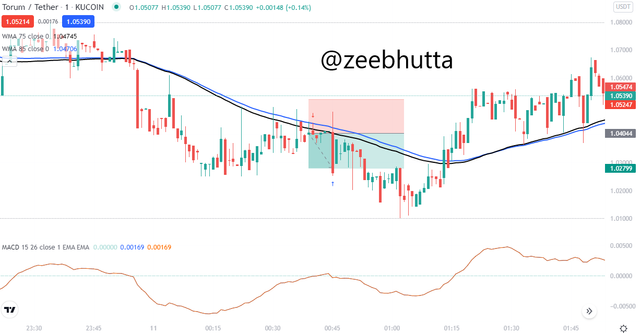
XTM/USDT
XTM/USDT
The price of TORUM/USDT was below the WMA lines indicating the downtrend and the signal line was below 0 as well. After considering the indicators, I opened sell position with RR of 1:1 and then booked profit as the price hit my TP easily.
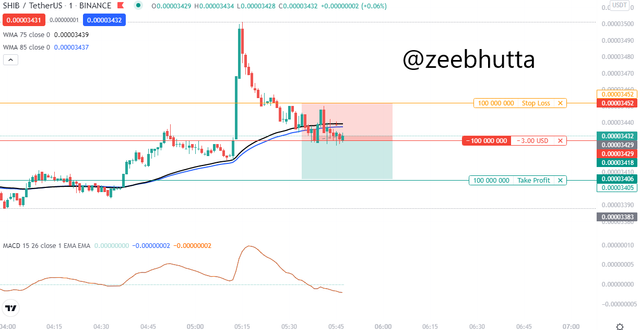
SHIB/USDT
SHIB/USDT
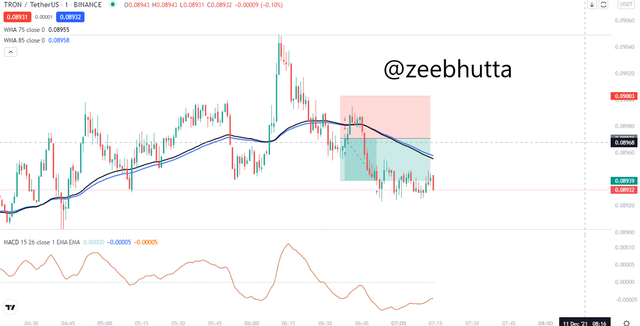
TRX/USDT
TRX/USDT
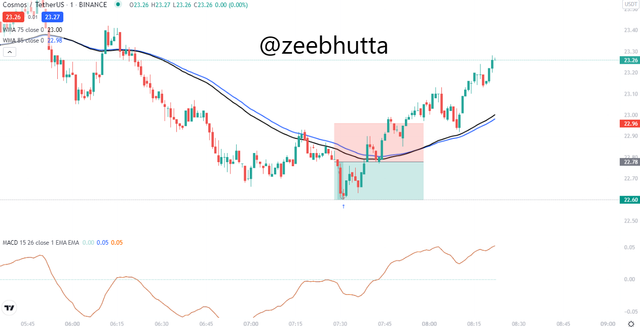
ATOM/USDT
ATOM/USDT
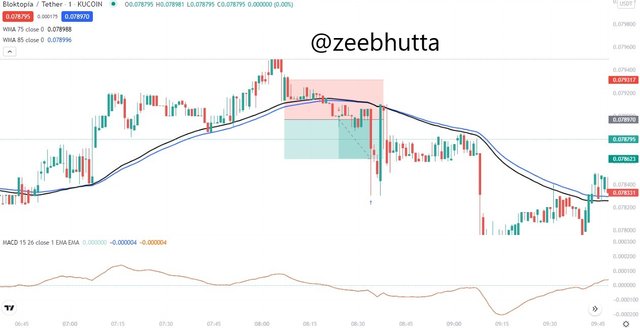
BLOK/USDT
BLOK/USDT
| S.no. | Pair | Buying Price | Selling Price | Profit | Loss | Time Frame |
|---|---|---|---|---|---|---|
| 1 | SHIB/USDT | 0.00003382 | 33.32 | 3 MIN | ||
| 2 | ICP/USDT | 27.14 | 16.51 | 3 MIN | ||
| 3 | LUNA/USDT | 62.92 | 1.6 | 1 MIN | ||
| 4 | GALA/USDT | 0.48936 | 3.59 | 3 MIN | ||
| 5 | NEAR/USDT | 9.855 | 1.13 | 1 MIN | ||
| 6 | XTM/USDT | 1.02787 | 73.18 | 1 MIN | ||
| 7 | SHIB/USDT | 0.00003407 | 22 | 1 MIN | ||
| 8 | TRX/USDT | 0.08965 | 16 | 1 MIN | ||
| 9 | ATOM/USDT | 22.78 | 1.8 | 1 MIN | ||
| 10 | BLOK/USDT | 0.078979 | 191.68 | 1 MIN |
5. You have to make a strategy of your own, it could be pattern-based or indicator-based. Please note that the strategy you make must use the above information. Explain full strategy including a time frame, settings, entry exit levels, risk management and place two demo trades, one for buying and the other for selling.
5. You have to make a strategy of your own, it could be pattern-based or indicator-based. Please note that the strategy you make must use the above information. Explain full strategy including a time frame, settings, entry exit levels, risk management and place two demo trades, one for buying and the other for selling.
I have also come up with a strategy but I will be using my preferred technical indicators. I will be using 2 technical indicators called EMA and MACD with custom settings. The main purpose of EMA is to work as a support/resistance while the MACD will represent the buy and sell point.
Since I will be using custom settings for technical indicators, the length of my EMA will be 200 and a closed source. As for the MACD, the basic setting will be sufficient.
Once the price is above the 200 EMA, it will be considered bullish and MACD with green histograms will further add confluence to an uptrend so that will be my entry point to the long position and vice versa. As for closing my positions, I always use RR of 1:1 which is my risk management for scalping setups.
I prefer to use this strategy in a shorter time frame like 1 hour or less. I will now show you how I trade using this strategy for both buying and selling scenarios:
Buying Demo Trade
From the below-mentioned chart of OMG/USDT, you can see that the price was above the 200 EMA which was acting as a support. It was a further indication of an uptrend and the MACD was also printing green histograms which simply means that we can open a long position. So, I entered the trade with RR of 1:1.
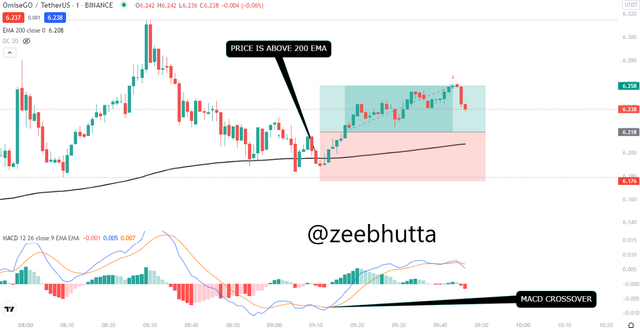
Later, the price easily hit the TP and the profit was booked.

Selling Demo Trade
As you can clearly observe from the chart of NEAR/USDT that the price is below 200 EMA which indicates that is in the bearish trend. Plus, MACD is making red histograms which confirms the downward trend. So, it is an ultimate signal to short the asset and I sold the asset with the RR of 1:1.
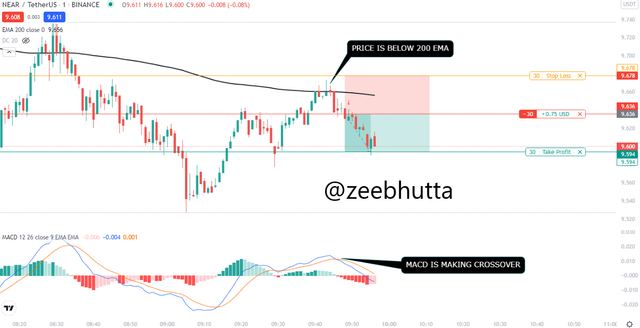
As you can see the price hit my TP and the profit was booked as well.

Conclusion
After completing my homework, I have come to the point that the Puria method indicative strategy is really effective scalping strategy that can help the trader to open profitable positions with the help of custom WMA and MACD. The demo trades also showed that I have a great grip on this strategy and I can start using this on my daily life for scalping.

Thanks For Visiting My Post And Your Appreciation
Cc:
@utsavsaxena11

Sort: Trending
Loading...