Heikin-Ashi Trading Strategy - Crypto Academy /S4W2 - Homework Post for Professor @reddileep.
Hello All...
This week I will try to join professor @reddileep's class, this week's lesson on Heikin-Ashi Trading Strategy.
.jpg) Background from canva
Background from canva

1.) Define Heikin-Ashi Technique in your own words.
Heikin-Ashi is a candlestick that was developed from traditional candlesticks so that traders more easily understand the trend that is happening in the market. although it looks very similar, the Heikin-Ashi chart has its own characteristic, namely, the opening price is opened from the average price of the previous candle so that the opening price is in the middle of the previous candle.
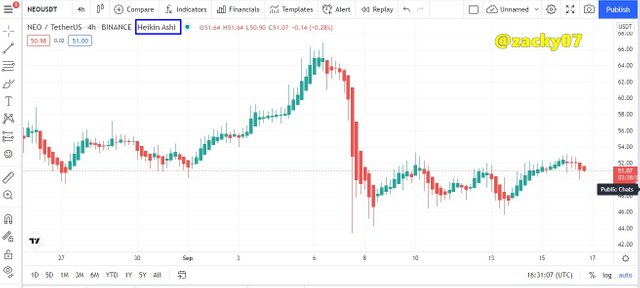
Heikin-Ashi has a function that is very helpful for traders in understanding the current trend. because this candlestick has a very neat pattern so the trend seen on the candlestick is very clear, for example when a bullish trend occurs traders can easily understand the bullish trend, this is all because the Heikin-Ashi candle has a relationship with all information from the previous candle such as the opening, closing, high, and low prices of the candles are recalculated with the average value. this is all to find out the opening of the next candle. This factor makes this candlestick smoother and easier to understand. The following is an example of the Heikin-Ashi candle
 Screenshoot fromTradingView
The Heikin-Ashi candlestick pattern is very neat which depicts a very clear bullish and bearish trend. even the wicks on the Heikin-Ashi candles also have important information about the current trend, when a bullish trend occurs without a down wick it is a strong bullish trend, and when a bearish trend occurs without an up wick it is a strong bearish trend.
2.) Make your own research and differentiate between the traditional candlestick chart and the Heikin-Ashi chart. (Screenshots required from both chart patterns)
 Screenshoot fromTradingView
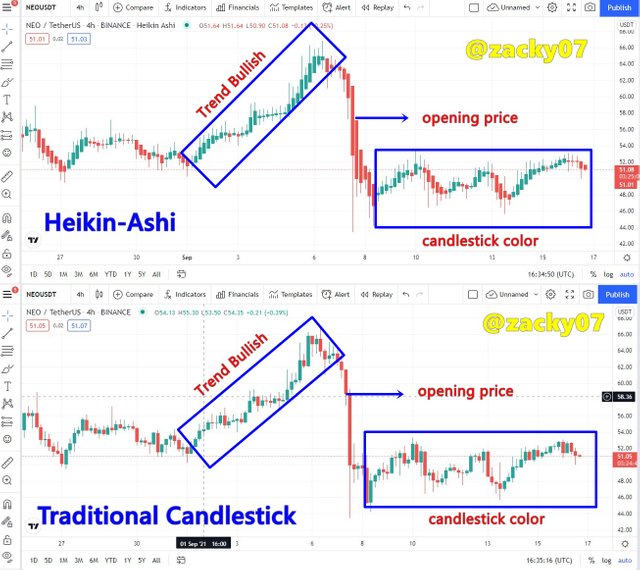
I have analyzed the differences between Heikin-Ashi candles and traditional candlesticks using the NEO/USDT trading pair. Here are some notable differences between the two graphs:
The trend in the market, you can clearly see the difference between the two charts, on the chart the current bullish trend is very easy to spot on Heikin-Ashi candles compared to traditional candlesticks, this proves the advantages of Heikin-Ashi charts can provide very good trend information good for traders.
Opening price, at the opening price of the Heikin-Ashi candle is formed from the average price of the previous candle which is in the middle of the previous candle while the opening price of the traditional candlestick is at the closing price of the previous candle.
Prices on the market, the price on the traditional candlestick market is more real because it is at the closing candle price, while the Heikin-Ashi candlestick price must find the average formula first so that the price does not match the current price.
Candlestick color, Heikin-Ashi candlestick color is very clear to the trend as the green candle color has a clear order of the trend, while the traditional candlestick color price changes that occur will produce a random candle color.
3.) Explain the Heikin-Ashi Formula. (In addition to simply stating the formula, you should provide a clear explanation about the calculation)
Open Price
 Screenshoot fromTradingView
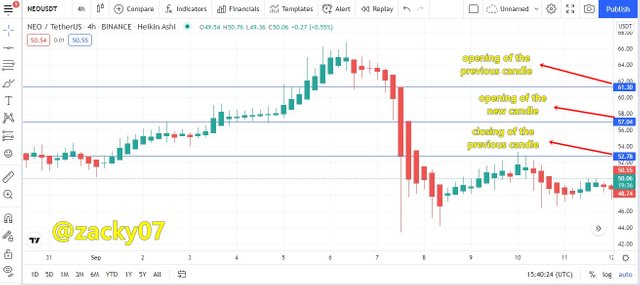
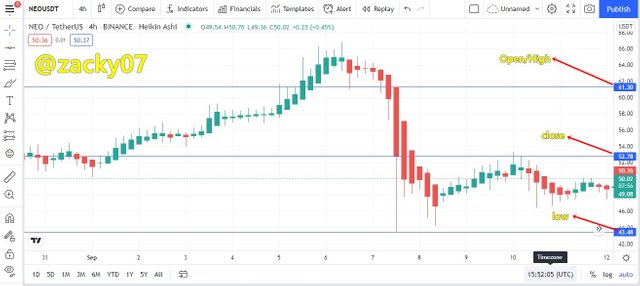
The opening price of a new candle is obtained by looking for the average of the previous candle. The data needed is the opening price and the closing price of the previous candle. The following is the formula for finding the opening price of a new candle.
From the formula above, let's calculate from the chart data above the opening price of the previous candle is $61.30 and the closing price of the previous candle is $52.78 so
Close Price
 Screenshoot fromTradingView
To find the closing price of the Heikin-Ashi candle, we need data from the candle, namely open, high, close, low. here's the formula.
From the formula above, let's calculate from the chart data above the opening price and high of $61.30, closing price of $52.78, and low of $43.48 so that:
High Price
To find the highest price for the Heikin-Ashi candle, we need data from the candle, namely the maximum value of the current candle's data open, high or close. as follows :
Low Price
To find the lowest price for the Heikin-Ashi candle, we need data from the candle, namely the minimum value of the current candle's data open, low or close. as follows :
4.) Graphically explain trends and buying opportunities through Heikin-Ashi Candles. (Screenshots required)
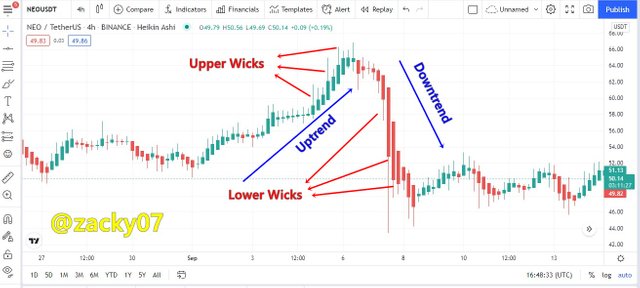
Heikin-Ashi candles are very suitable to distinguish the current trend, if a strong uptrend occurs then the candle has an upper wick and no lower wick, and if a strong downtrend occurs when the candle has a lower wick and no upper wick, this is important information obtained for both trends.
 Screenshoot fromTradingView
we can see in the picture above that when an uptrend occurs, the candle has a repeated upper wick, so it can be said that an uptrend is occurring, and when a trend reversal occurs the candle has a repeated lower wick so that it can be said that a strong downtrend is occurring, so traders can easily analyze market movements using Heikin-Ashi candles.
 Screenshoot fromTradingView
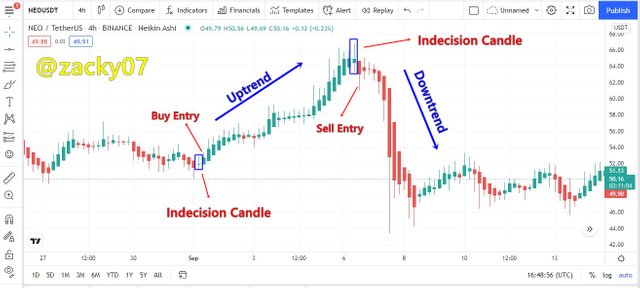
In analyzing trades to enter the market using Heikin-Ashi candles, it can be seen with the initial information on the formation of an indecision candle in the form of a Doji candle and then followed by a strong bullish candle movement so that at that time it is a buy signal for traders as shown in the picture, and vice versa when the indecision candle followed by the formation of a strong bearish candle then at that time it is a sell signal for traders when trading
5.) Is it possible to transact only with signals received using the Heikin-Ashi Technique? Explain the reasons for your answer.
The Heikin-Ashi technique gives a very good signal to the trend, but it is very risky to only use one technique in trading because the price of a cryptocurrency asset is very volatile so the price can change and reverse at any time, it could be that the signal given is the wrong entry signal. and can have a detrimental impact on our trading, so it is highly recommended to combine it with other indicators so that the risk of failure in trading can be minimized.
The EMA indicator is the right pair to combine with the Heikin-Ashi candle so that cryptocurrency chart analysis becomes more accurate by considering some of the information provided and the entry signal from the combination of the EMA indicator and the Heikin-Ashi technique.
 Screenshoot fromTradingView
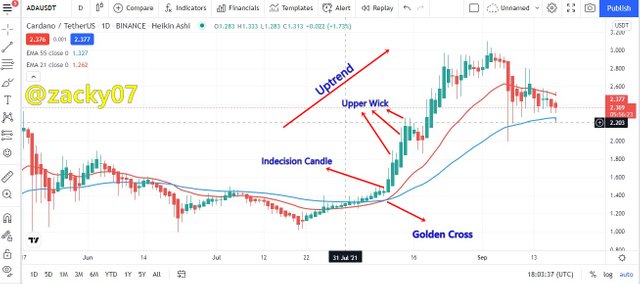
It can be seen from the chart above that when I combined the EMA and the Heiki-Ashi technique there were several trading signals such as when the golden cross occurred there was an indecision candle and a strong bullish candle was formed after that, so this can be said to be a very good buy signal. because by combining the EMA indicator and the Heikin-Ashi Technique, traders can easily analyze their trades.
6.) By using a Demo account, perform both Buy and Sell orders using Heikin-Ashi+ 55 EMA+21 EMA.
I Use a demo trading view account to trade the Heikin-Ashi technique with EMA 55 and EMA 21
Buy Order
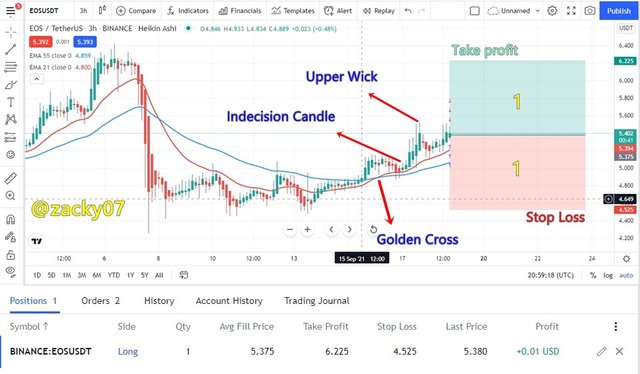 Screenshoot fromTradingView
I tried to use the EOS/USDT trading pair by combining the EMA and the Heikin-Ashi technique. when the EMA 55 and EMA 21 lines cross each other (Golden Cross) then this is a trend reversal signal, and we can see that after the indecision is formed it is followed by a strong bullish candle, so this is a buy signal for me, and I set a Take profit and stop loss comparison 1:1 as seen in my trading details above
Sell Order
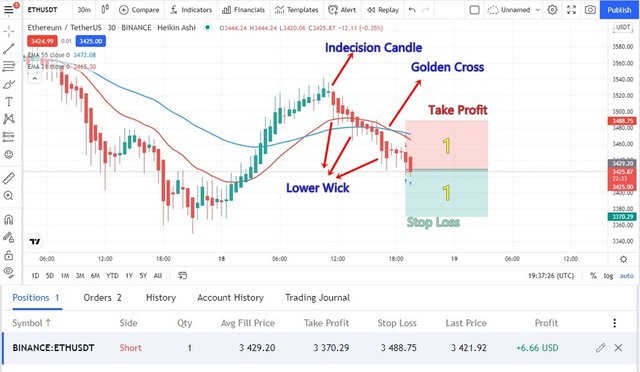 Screenshoot fromTradingView
I tried to use the ETH/USDT trading pair by combining the EMA and the Heikin-Ashi technique. When the formation of an indecision candle followed by a strong bearish candle. I confirm a sell signal when the golden cross is formed, and I immediately set a 1:1 take profit and stop loss. with my trade details as shown in the picture above.
Conclusion
Heikin-Ashi is a candlestick that has advantages in terms of a smoother graphic appearance than traditional candlesticks, and can also be used to analyze trends that occur in the market, the Heikin Ashi technique is very suitable to be combined with the EMA indicator when analyzing trades so as to increase the success of trades made by traders