[Effective Trading Strategy using Line Charts] - Steemit Crypto Academy | S6W1 | Homework Post for @dilchamo
Hello All...
At this time Steemit Crypto Academy has entered season 6, and I will try to join this season. This week I will try to join professor @dilchamo's class, this week's lesson on Effective Trading Strategy using Line Charts.
 Background from Canva
1.) Define Line charts in your own words and Identify the uses of Line charts.
In conducting technical analysis, traders really need charts to compile and create their trading strategies, so if we look at websites such as Tradingview, we will find several types of charts, but line charts are the simplest charts compared to other types of charts.
Screenshot from Tradingview
The line chart is the chart that is most easily understood by traders because the line chart is only one line that is interconnected and forms price movements. a line graph simply simplifies some of the information that some other graphs have, so a lot of information is lost on a line graph. so the line chart only provides important information about the movement of a line connecting the closing of an asset price.
So with a very simple line graph display, it makes it very easy for traders to understand the movement of assets in the market, with just a glance, traders can immediately understand the movement of the asset, in contrast to other charts such as candlestick charts, traders must understand some information first, such as the opening price. , closing price, high price, and low price of an asset.
Uses of Line Charts
Line charts are one of the most suitable charts for technical analysis to start their long-term trading. Line charts can provide important information such as the history of previous price movements, traders can also determine previous trends very easily, traders can also determine support and resistance efficiently, this is all because line charts have a very simple and easy to understand appearance for all traders.
2.) How to Identify Support and Resistance levels using Line Charts (Demonstrate with screenshots)
In conducting technical analysis determining support and resistance levels is a very important strategy for taking action in predicting future prices. so by finding the right support and resistance areas it will increase the chances of future price predictions, let's discuss both levels. Support and resistance levels are very easy to identify on a line chart. because line charts provide a very simple appearance and can make it easier for traders to draw support and resistance lines.
The support level is the level when the price of a cryptocurrency asset is at its lowest level or it can be said that the price of the asset is falling and then rising again, this level occurs because many traders take profits to sell their assets blindly the price drops, then traders are ready to buy back the asset. this to make the price go up. it is at this time that traders predict a trend reversal from bearish to bullish.
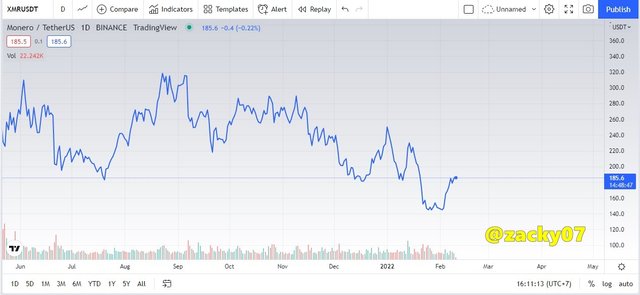
To be able to identify support levels on the line chart, we can see from the image below.
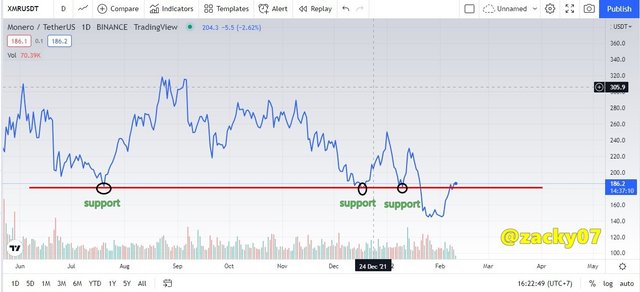
Screenshot from Tradingview
We can see from the line chart on the XMR/USDT pair above, several times the support level has occurred here, traders have received important information to enter a trade. if an asset price has touched the support line of the previous reference support level then traders can enter the trade by placing a long entry in the hope that the price will reverse. and if an asset price passes the support level, traders can place a short entry, because the price will likely fall.
While the resistance level occurs when the price of an asset is at its highest level and the price reverses from rising to falling, at this level, many traders buy an asset that makes the price rise, when the price rises traders who want to take profit sell their assets and make the price go down so that it forms a resistance level. It is at this time that traders predict asset prices will reverse from a bullish trend to a bearish trend.
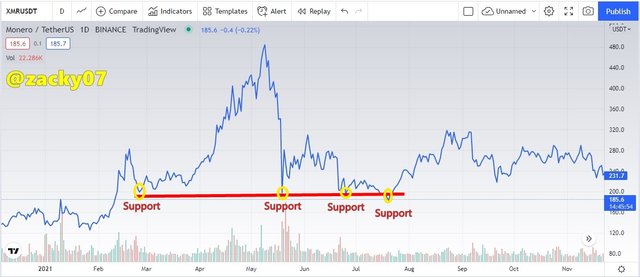
To be able to identify resistance levels on the line chart, we can see in the image below.
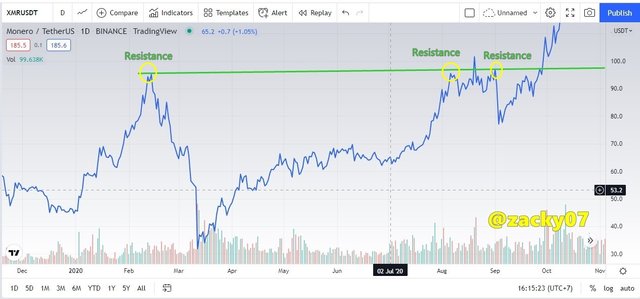
Screenshot from Tradingview
We can see from the line chart in the XMR/USDT pair above, several times this resistance level has occurred as a reference for traders to be able to predict future prices, if the price touches a resistance level and the price drops again, traders will place a short entry with the hope of a trend reversal and hope that the price will continue to fall, and if the price of an asset passes the resistance level, traders will place a long entry because the price may continue to rise because it has broken the resistance level.
The line chart is very easy to determine support and resistance levels, by understanding and being able to determine the right support and resistance levels, the chances of success for traders in predicting prices will be even greater.
3.) Differentiate between line charts and Candlestick charts. ( Demonstrate with screenshots)
The difference between a line chart and a candlestick chart is that a line chart has a simple appearance and only depicts a line connecting the closing price of an asset, so very little information is provided. while candlestick charts have a lot of information and which can help traders in analyzing the market better.
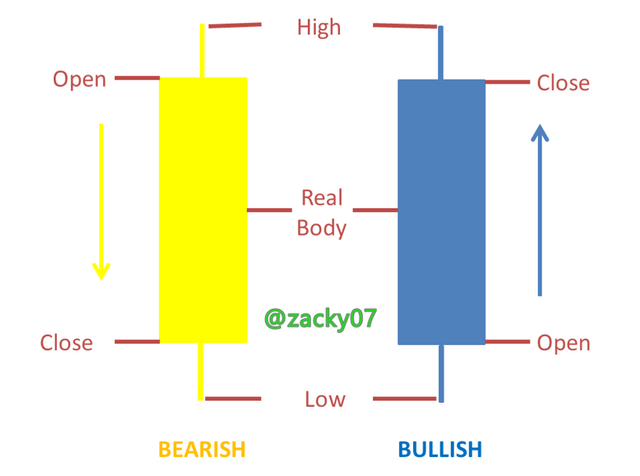
Edited from Powerpoint
From the picture above, we can see that the candlestick chart provides a lot of information such as the difference in the color of the candle that can be set, the candlestick chart also provides information such as the opening price, closing price, highest price, and lowest price. Let's see the difference between the two in the image below.
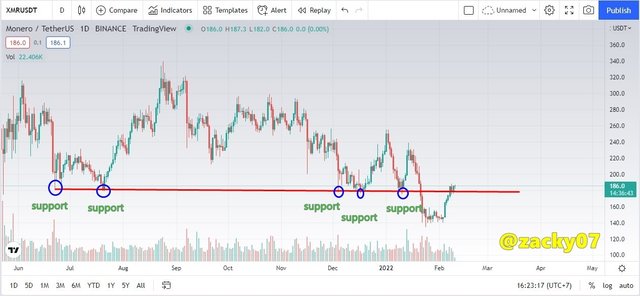
Screenshot from Tradingview
From the picture above, we can see that there are several differences in determining the support level, on the line chart it only touches the support level a few times while on the candlestick chart the support level occurs more than the line chart, this is all because the candlestick chart has the lowest price indicated by the tail of the candle. low part. so on the candlestick chart even though the lowest price occurred in a very short time it was still depicted in the form of a candle.
4.) Explain the other Suitable indicators that can be used with Line charts. (Demonstrate with screenshots)
To perform technical analysis using line charts, it is necessary to combine several indicators so that the opportunities for profit are greater, one of which is to combine line charts with the RSI indicator.
The RSI indicator is one indicator that is very suitable to be used to provide good entry signals in analyzing line charts. The RSI indicator has two bands, namely the upper band and the lower band which provide overbought and oversold information. when the price has crossed the upper band then the price of an asset is overbought and vice versa if the price has crossed the lower band then the price has been oversold. usually, this is a trend reversal signal. let's look at the image below.
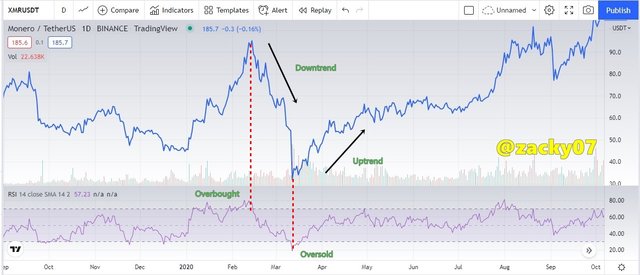
Screenshot from Tradingview
From the picture above we can see the match between the line chart and the RSI indicator, this can convince traders to make decisions before entering the market. When the price touches the upper band or is overbought we can see the price of an asset turning down. and when the price of an asset touches the lower band or is oversold the price of an asset reverses to go up. so as to increase the chances of traders to profit by combining the RSI indicator and line charts.
5.) Prove your Understanding of Bullish and Bearish Trading opportunities using Line charts. (Demonstrate with screenshots)
Well, let's look at the opportunity to enter a trade in a bullish phase and a bearish phase with the help of the RSI indicator.
Trade the Bullish Trend using the RSI Indicator
When the line chart shows a bullish trend, traders will place long entries to take profits, therefore some indicators are needed to increase the chances of success in their trading, as shown below.
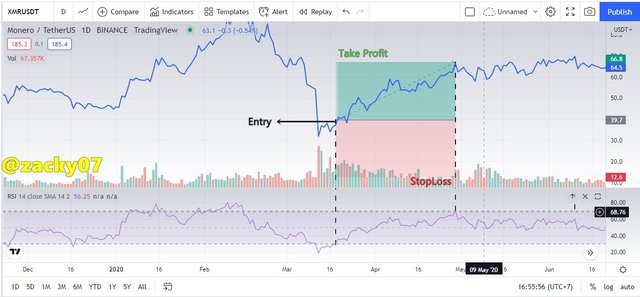
Screenshot from Tradingview
in the picture above of the XMR/USDT pair, we can see when the line chart provides information on the bullish trend we can confirm by looking at the RSI indicator, at that time the price crossed the lower band or was oversold, so we waited a while for an entry signal, namely when the price started to touch the band. back down and enter the inner area, that's when we set an entry and start placing a long entry to maximize profits and minimize losses. I put a 1:1 risk ratio.
Trade the Bearish Trend using the RSI Indicator
When the chart will show a bearish trend, it is a good time to make a short entry to take advantage of the bearish trend, as in the example picture below.
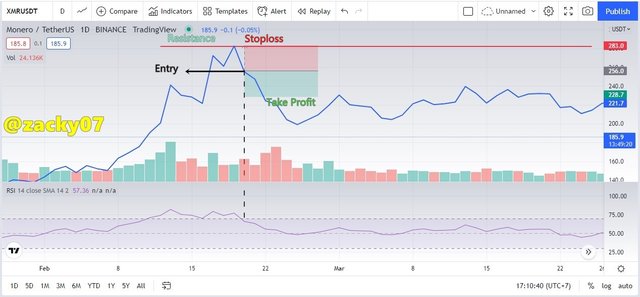
Screenshot from Tradingview
From the picture above on the XMR/USDT trading pair, we can see that when the line chart provides information on the bearish trend, we can confirm it by looking at the RSI indicator, when the price crosses the upper band or is overbought, we will wait for confirmation of the entry signal, namely when the price touches the upper band again. and entered the deep area, that's when it was a good time to enter a trade using a short entry, I set a stop loss at the previous resistance level and set a 1:1 risk ratio. so that by confirming with indicators and installing a risk ratio, the opportunity to get a profit is even greater and if there is a loss it will be minimized by the trading strategy
6.) Investigate the Advantages and Disadvantages of Line charts according to your Knowledge.
Advantages of Line Charts
The graphic display is very easy to understand so the line chart is very suitable for beginners because it has a simple display that is only a line that shows the increase and decrease in the price of an asset, very different from candlestick charts which are a bit complicated for beginners who want to start their trading.
Can determine the main support lines and main resistance lines without considering price fluctuations that often occur such as candlestick charts that provide information about price fluctuations at any time. so traders can easily draw lines and determine support and resistance levels on line charts.
Can combine several indicators in an easy to understand way, such as combining the Moving Average indicator with a line chart.
Traders can also see the real price in the market without being affected by sudden price fluctuations so that traders can minimize false signals.
Line charts for traders who use long-term trading, because traders don't have to know price fluctuations every time, long-term traders usually only see previous price movements without seeing short-term price fluctuations.
Disadvantages of Line Charts
Line charts provide traders with very little information so it is very difficult for traders to predict prices precisely and accurately, so line charts are very rarely used by professional traders.
Line charts are not suitable for use in short-term trading, because they do not provide complete information on price fluctuations, so traders will find it very difficult to start short-term trading using line charts
These charts are generally rarely used by experienced traders.
Line charts are very difficult to predict future prices, usually traders who use line charts to trade have to combine them with other indicators to increase their chances of trading success
Conclusion
The line chart is one of the most friendly charts to use in understanding price fluctuations, because this chart is only in the form of one line connecting the closing prices, so for traders who are new to trading, it is very suitable to use a line chart because it looks easy to understand.
Due to their very simple appearance, line charts also have a drawback, namely that the information they provide is very minimal, so it is very difficult to determine a trading strategy, so it can be said that line charts are usually not suitable for the trading style of professional traders.