Crypto Academy / Season 4 / Week 2 - Homework Post for @reminiscence01 (Technical Indicators)
Hello All...
This week I will try to join professor @reminiscence01's class, this week's lesson on Technical Indicators.
.jpg) Background from canva
Background from canva

QUESTION 1
a.) In your own words, explain Technical indicators and why it is a good technical analysis tool.
A technical Indicator is a tool that traders use to help analyze a cryptocurrency chart. With the help of technical indicators, the prediction of a price in the future will be more accurate. so it can be said that the opportunity to predict the price of an asset in the future will be even greater. With the help of technical indicators, a trader will more easily understand chart patterns that occurred in the past so that traders can more easily carry out technical analysis.
Asset price movements are caused by demand and supply made by sellers and buyers in the market, so it can be said that price movements in the market tend to occur repeatedly, this factor causes cryptocurrency assets to fluctuate in price. so with technical indicators will help traders to understand market conditions in the past. There are several signals to be obtained from technical indicators such as the opening price and closing price of the previous asset. with price signals obtained in the past, will help traders to analyze prices in the future.
In conducting technical analysis, traders really need tools such as technical indicators so that traders will easily understand the market conditions of an asset that are happening, and it will be very easy for traders to make accurate decisions in entering their trades. one example of a very important technical indicator in conducting technical analysis is that traders will find it easier to find out the trend that is happening in the market so that traders can predict the trend will continue or will experience a trend reversal. so basically by doing technical analysis and the help of technical indicators can increase the chances of success of traders in making a profit.
b.) Are technical indicators good for cryptocurrency analysis? Explain your answer.
In my opinion, technical indicators are needed by traders in analyzing cryptocurrency assets in trading, because the price of a cryptocurrency asset fluctuates every time, traders are faced with two situations, namely profits and maybe in a loss situation, this is what must be planned by traders in order to optimize their profits. Technical indicators are very helpful for giving signals that are happening in the market, and traders can also easily determine the current trend and can help predict future prices.
for example, when a trader uses the EMA 50 and EMA 200 indicators when the golden cross occurs, the traders have received a trend reversal signal, this information is very useful in helping traders predict the next price movement pattern. so that with this signal traders can adjust their take profit and stop loss in order to optimize profits and minimize the scale of losses.
c.) Illustrate how to add indicators on the chart and also how to configure them. (Screenshot needed).
Well, I will try to illustrate how to add an indicator to tradingview. OK, let's look at the following steps.
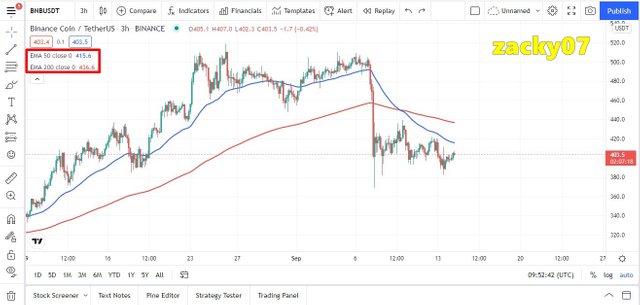
- The first thing to do is to choose a trading pair, I choose BNB/USDT and then select indicators (fx) as in the example in the image below.
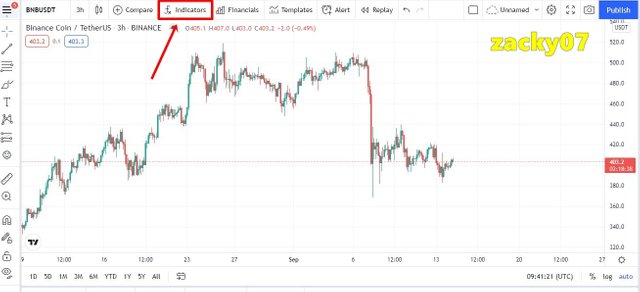
source from Tradingview
- Then enter the indicator, I choose EMA
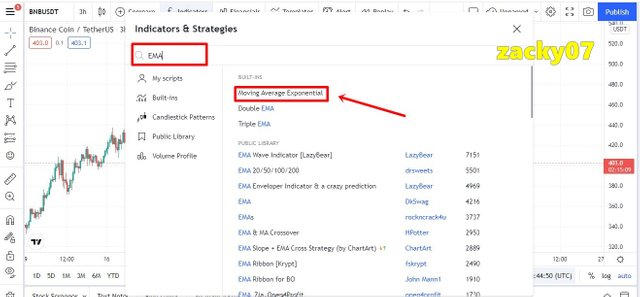
source from Tradingview
- Then after selecting, the indicator select the settings menu as shown below.
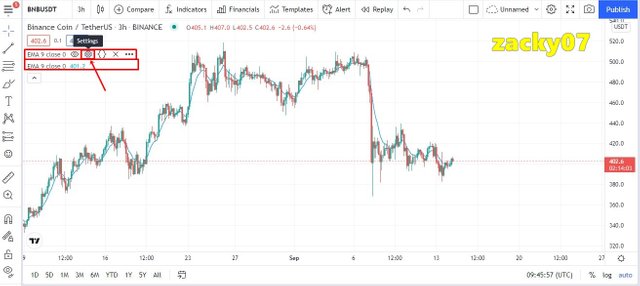
source from Tradingview
- After that will appear on the menu rules Inputs, style, visibility. In the inputs menu I have set two EMA lines, the first EMA with a length of 50 and the second EMA with a length of 200 to further clarify the difference between the EMA lines
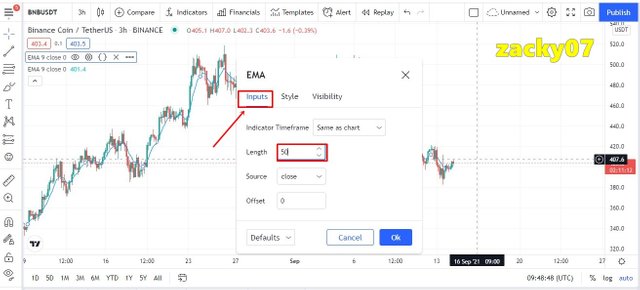
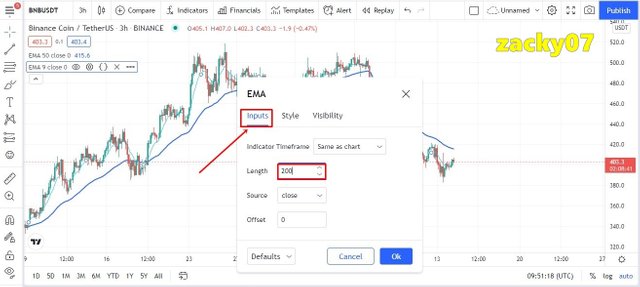
source from Tradingview
- After that let's set the EMA style, my first EMA line is blue while my second EMA line is red to distinguish the two EMA lines.
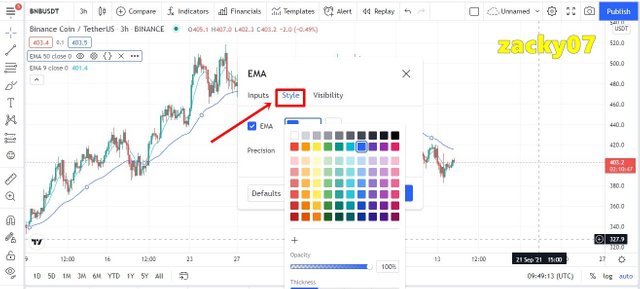
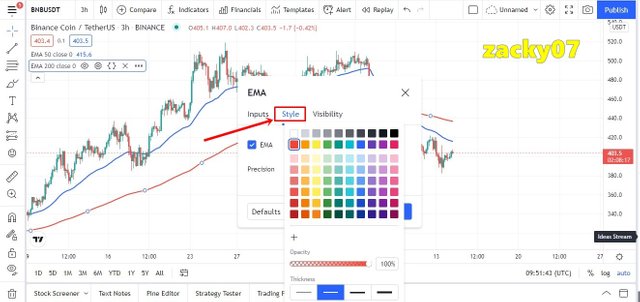
source from Tradingview
- In visibility I followed the basic settings.
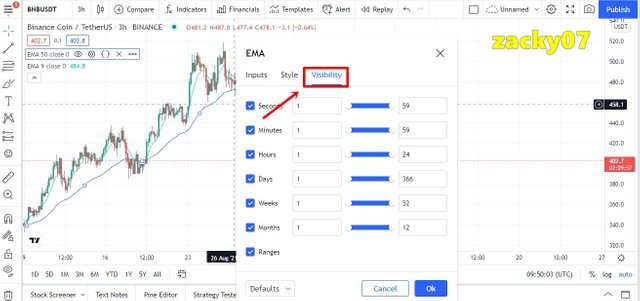
source from Tradingview
- Here are the EMA indicators that I have successfully added and adjusted
source from Tradingview
QUESTION 2
a.) Explain the different categories of Technical indicators and give an example of each category. Also, show the indicators used as an example on your chart. (Screenshot needed).
Trend Based Indicators
Trend-based indicators are very useful for traders before entering the market, so with the help of this indicator traders can find out how strong the trend is, if a trader goes against the trend when trading this has a big risk, then this indicator can help traders determine trend or the strength of the trend before entering a trade.
source from Tradingview
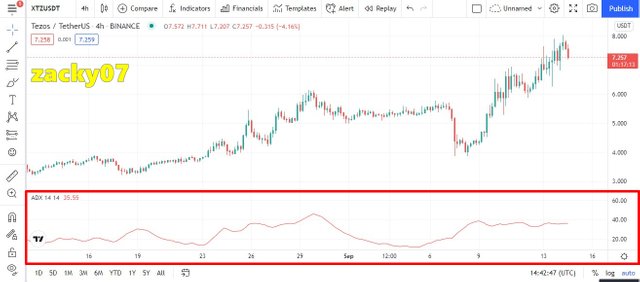
I tried to use the Average Directional Index (ADX) in determining the current trend and the strength of the trend. So in the picture above, we can see that the XTZ/USDT trading pair is experiencing a bullish trend. As for the ADX value in the trading pair, it is 35.55, the ADX indicator has a range from 0 to 100, if the indicator has an ADX value below 25, it is advisable to avoid trading because the trend is relatively weak.
Volatility Based Indicators
Volatility based indicators are especially useful when chart patterns experience high volatility. When the market experiences an increase and decrease in asset value, this indicator is needed by traders to determine when they should sell and buy assets. let's see the implementation of the indicator on the chart below
source from Tradingview
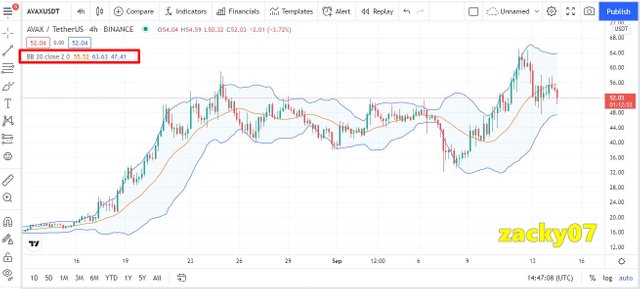
I tried to use the Bollinger Band (BB) indicator in determining market conditions were experiencing volatility. In the AVAX/USDT pair, we can see that the market is experiencing volatility so here we can set a short entry or long entry, provided that if the candle touches the lower band then we can place a long entry which signals a buy signal, whereas if the candle touches the upper band we can place a short entry which signals a sell signal. in the chart above, some of the time the candle touches the upper band so this is a sell signal for a trader.
Momentum-Based Indicators
Momentum-based indicators are very useful for traders to see how strongly the asset continues to move in a trend, for example when a bullish trend is occurring, of course the price increase will be saturated so that it reaches overbought so that in conditions like this is a sell signal for a trader because many traders will sell the asset those who make the price go down and vice versa when the trend is bearish when the price of an asset reaches oversold is a buy signal for a trader. let's apply the indicator on the chart below.
source from Tradingview
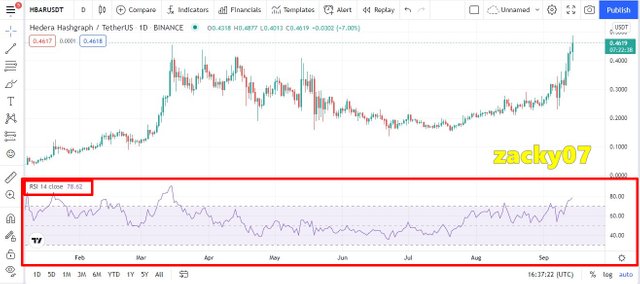
I tried to use the Relative Strength Index (RSI) indicator on the HBAR/USDT trading pair, the RSI value for the pair is 78.62 so it can be said that the market is overbought. From the RSI indicator above, we can see the overbought line is at an RSI value of 70 and above, while the oversold line is at a value of 30 and below. and the HBAR/USDT pair above has reached overbought and is a sell signal for a trader.
b.) Briefly explain the reason why indicators are not advisable to be used as a standalone tool for technical analysis.
In using technical indicators that a trader will use in accordance with ongoing market conditions, each indicator has its functions, advantages, and disadvantages, so using just one indicator is not recommended for a trader, because each indicator has its own drawbacks, to cover the shortfall. a trader is strongly advised to combine the appropriate indicators.
when a trader combines these indicators in technical analysis, a trader can determine a good entry strategy and can increase the chances of profit when trading takes place, because by combining several indicators traders can determine whether the entry signal is strong or not. So a trader must be careful before entering the market, a trader must be able to determine a good entry signal, one of which is by combining several indicators so that the analysis further increases the chances of success in trading.
c.) Explain how an investor can increase the success rate of a technical indicator signal.
Before starting to carry out technical analysis with the help of technical indicators, an investor must be able to learn and understand these indicators. In this case, knowledge of technical indicators is needed and experience is also very influential in every success in trading. the settings for the indicator configuration must also be adjusted according to the trading chart to make it easier to analyze the chart.
Investors must also be able to master various technical indicators, not just one that he likes. with good mastery of various indicators and combining suitable indicators will increase the chances of success, because it provides a variety of trading signal options, if several indicators give almost the same signal, it can be said that the signal given by the indicator will be more accurate.
Conclusion
Technical indicators are one of the tools that are closely related to technical analysis, so the application of technical indicators is needed to make it easier for traders to understand and predict the price of an asset. A trader is also highly recommended to be able to understand various technical indicators and combine them with a suitable trading strategy, so as to increase the chances of a high level of success in trading.
Hello @zacky07 , I’m glad you participated in the 2nd week Season 4 of the Beginner’s class at the Steemit Crypto Academy. Your grades in this task are as follows:
Observations:
The opening price and closing prices are not market signals. They are parameters utilised in some indicators to give trading signals.
Recommendation / Feedback:
Thank you for completing your homework task.